
- Home >
- Stock Photos >
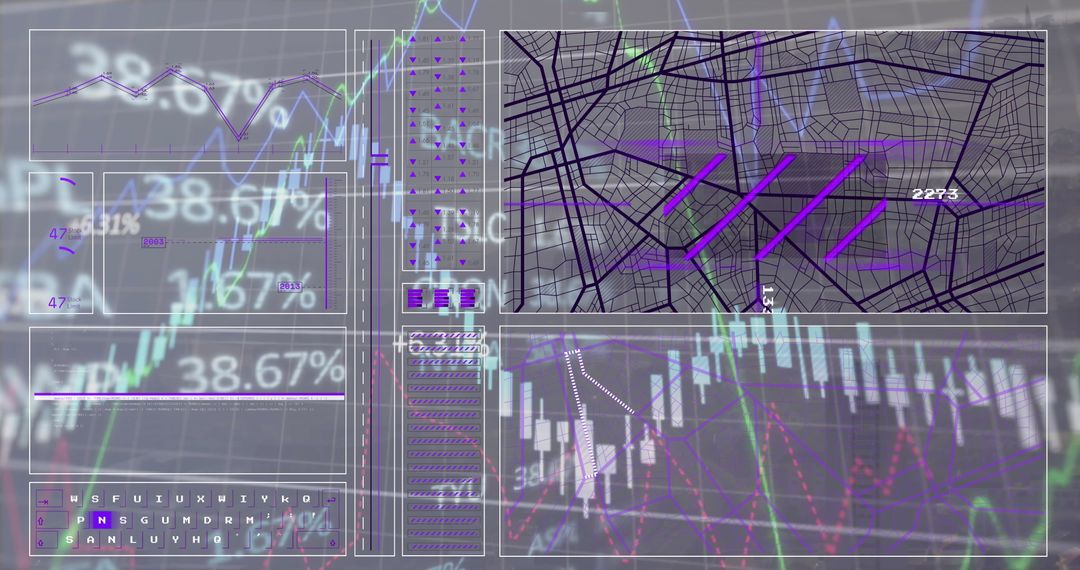
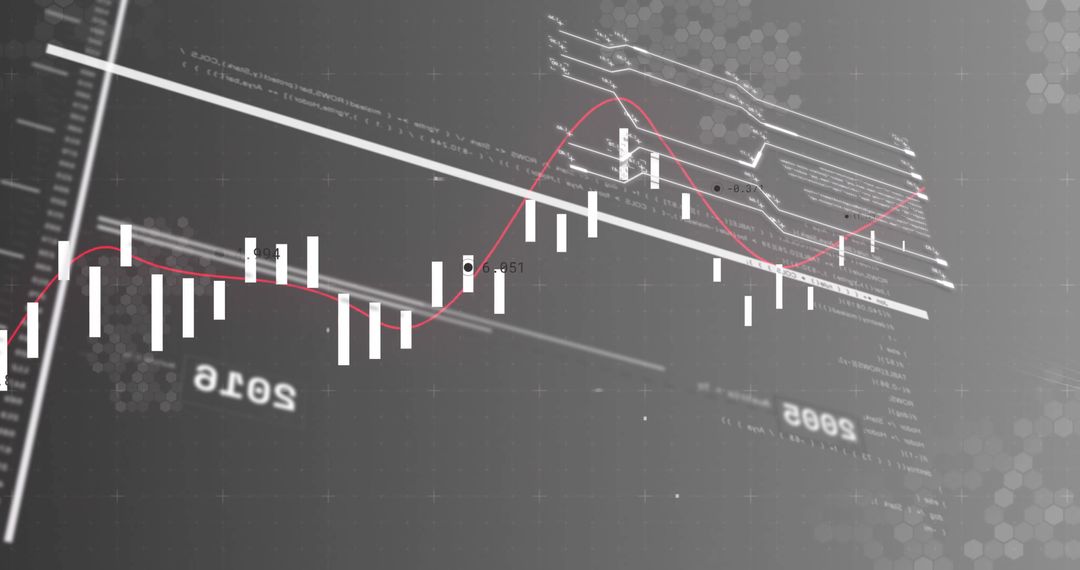
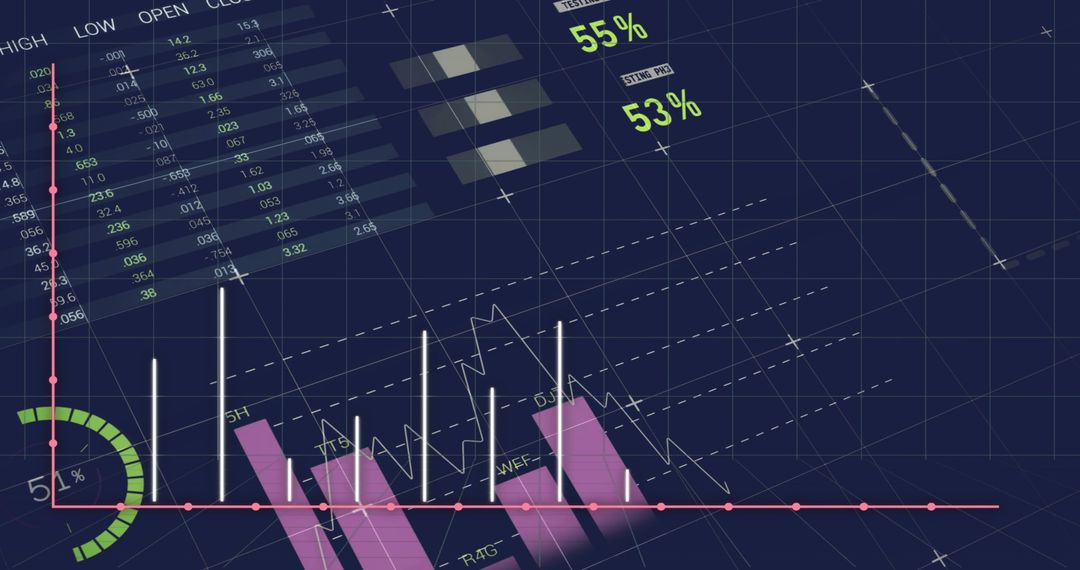
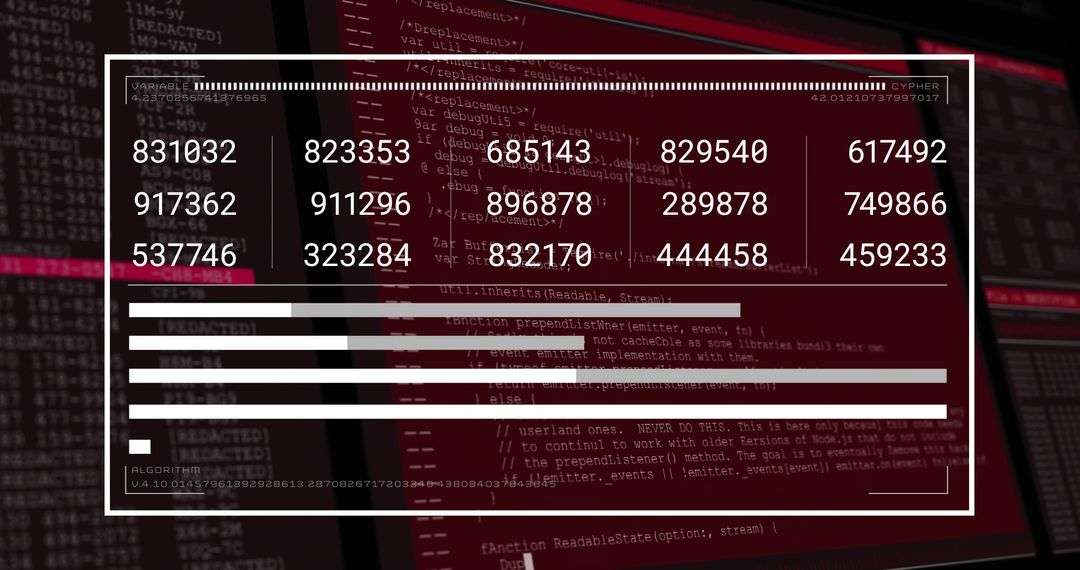
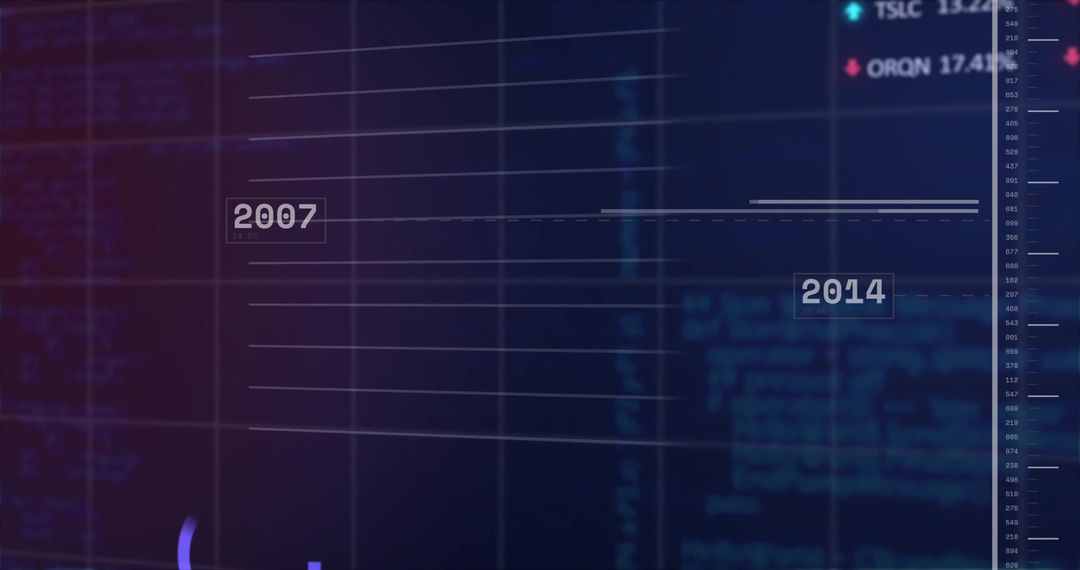
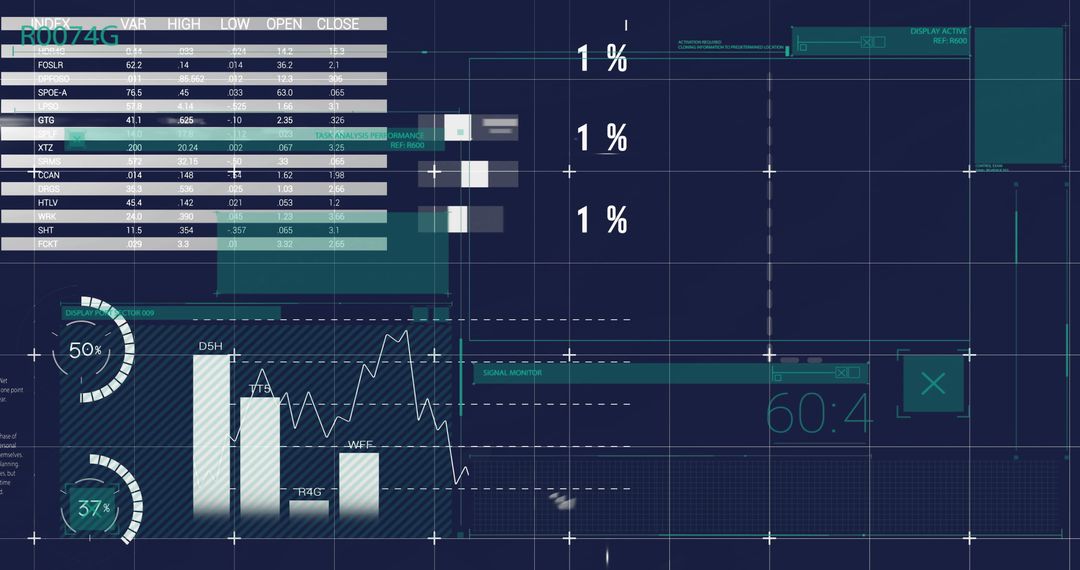
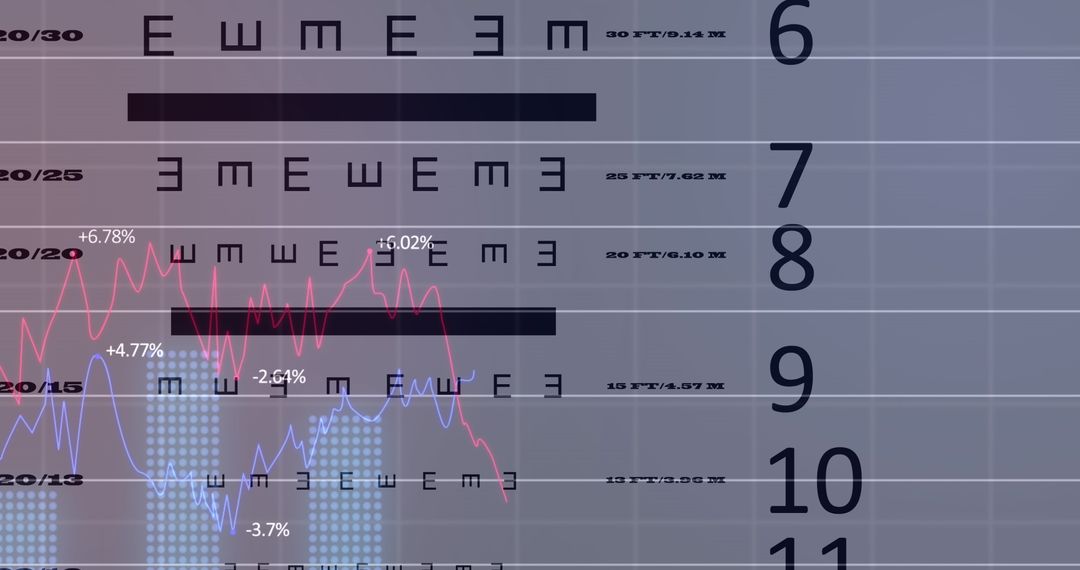
- Digital Stock Market Data Interface with Bar Graphs and Numbers
Digital Stock Market Data Interface with Bar Graphs and Numbers Image
Presentation of digital interface featuring statistics and stock market data visualizations on a blue background. Ideal for presentations related to financial analysis, business strategy, stock trading, or economic studies, encapsulating the intersection of technology and finance.
Powered by  - Get 15% off with code: PIKWIZARD15


2
downloads
downloads
Tags:
More
Credit Photo
If you would like to credit the Photo, here are some ways you can do so
Text Link
photo Link
<span class="text-link">
<span>
<a target="_blank" href=https://pikwizard.com/photo/digital-stock-market-data-interface-with-bar-graphs-and-numbers/6503b6e23c08ea2f7a8649514322858c/>PikWizard</a>
</span>
</span>
<span class="image-link">
<span
style="margin: 0 0 20px 0; display: inline-block; vertical-align: middle; width: 100%;"
>
<a
target="_blank"
href="https://pikwizard.com/photo/digital-stock-market-data-interface-with-bar-graphs-and-numbers/6503b6e23c08ea2f7a8649514322858c/"
style="text-decoration: none; font-size: 10px; margin: 0;"
>
<img src="https://pikwizard.com/pw/medium/6503b6e23c08ea2f7a8649514322858c.jpg" style="margin: 0; width: 100%;" alt="" />
<p style="font-size: 12px; margin: 0;">PikWizard</p>
</a>
</span>
</span>
Free (free of charge)
Free for personal and commercial use.
Author: Creative Art
Similar Free Stock Images

Premium


Premium


Premium


Premium


Premium


Premium


Premium


Premium


Premium


Premium


Premium


Premium


Premium


Premium


Premium


Premium


Premium


Premium


Premium


Premium


Premium


Premium


Premium


Premium

