- Home >
- Stock Photos >
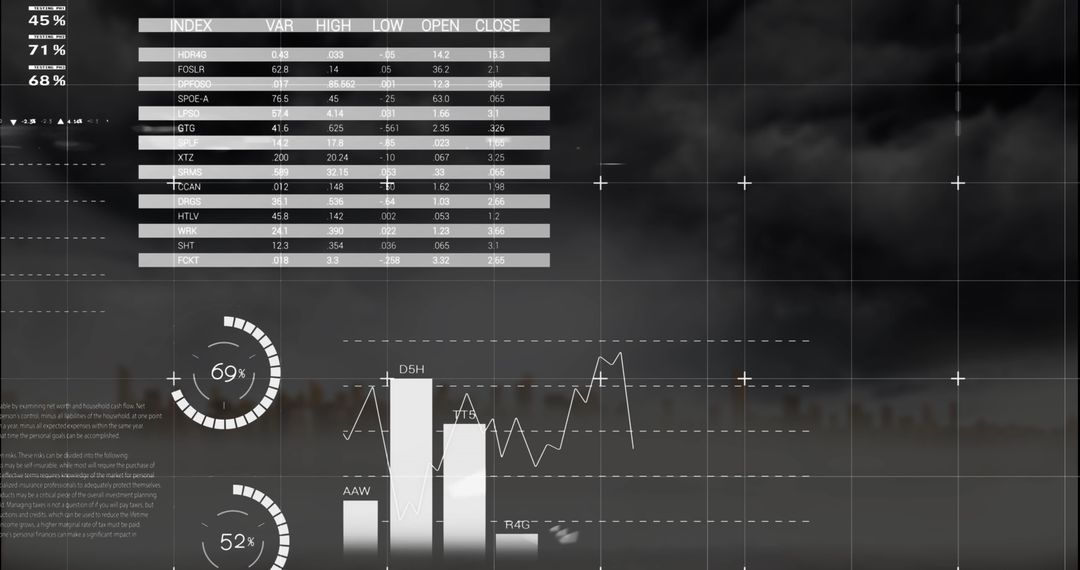
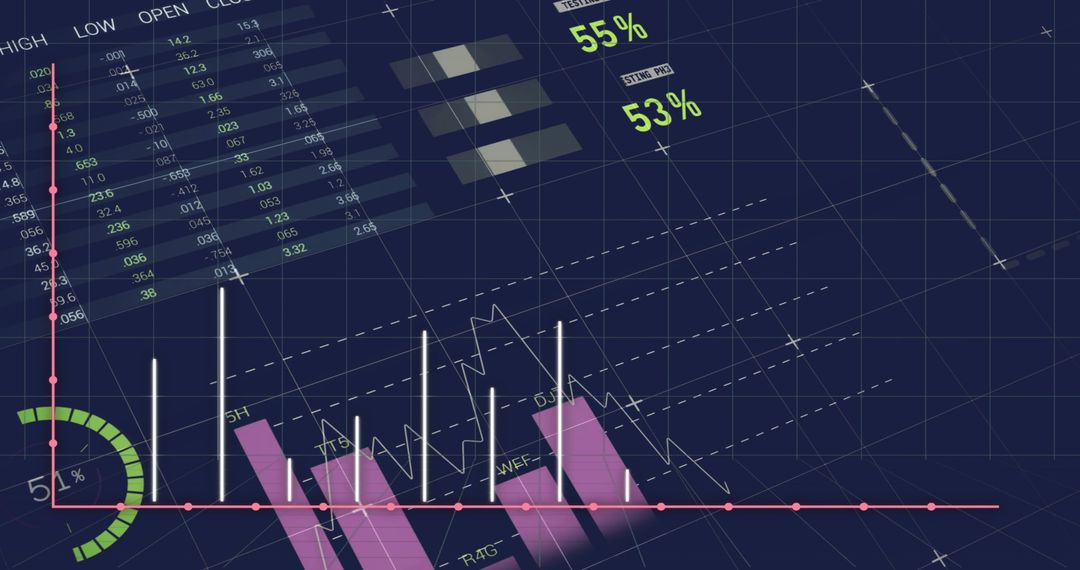
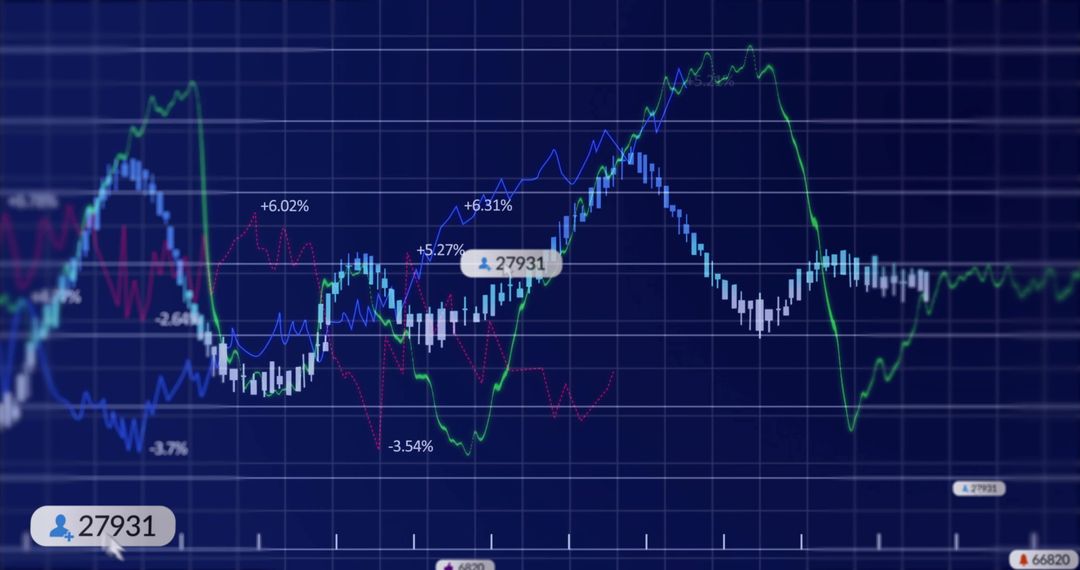
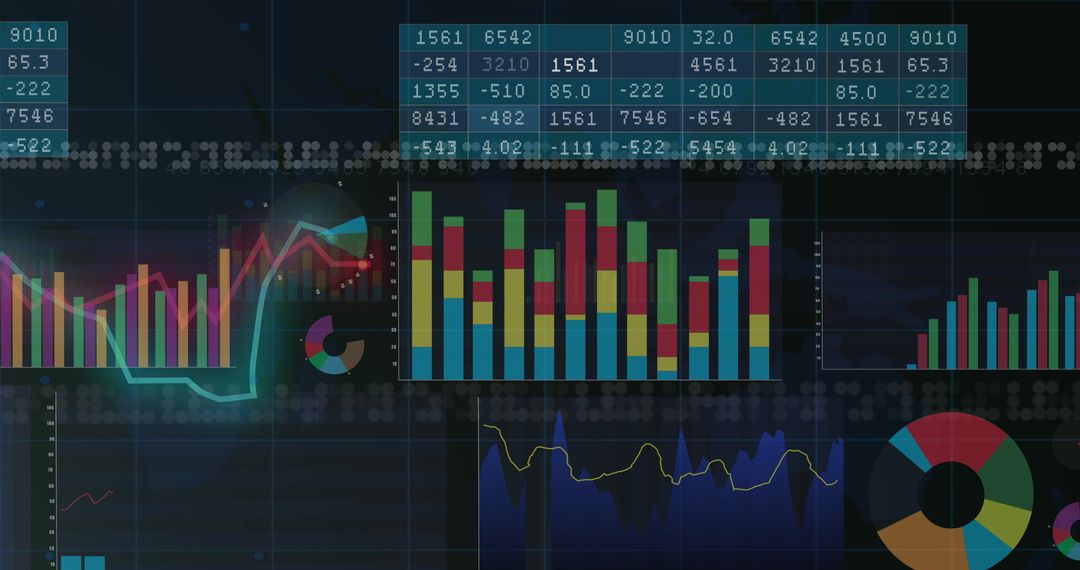
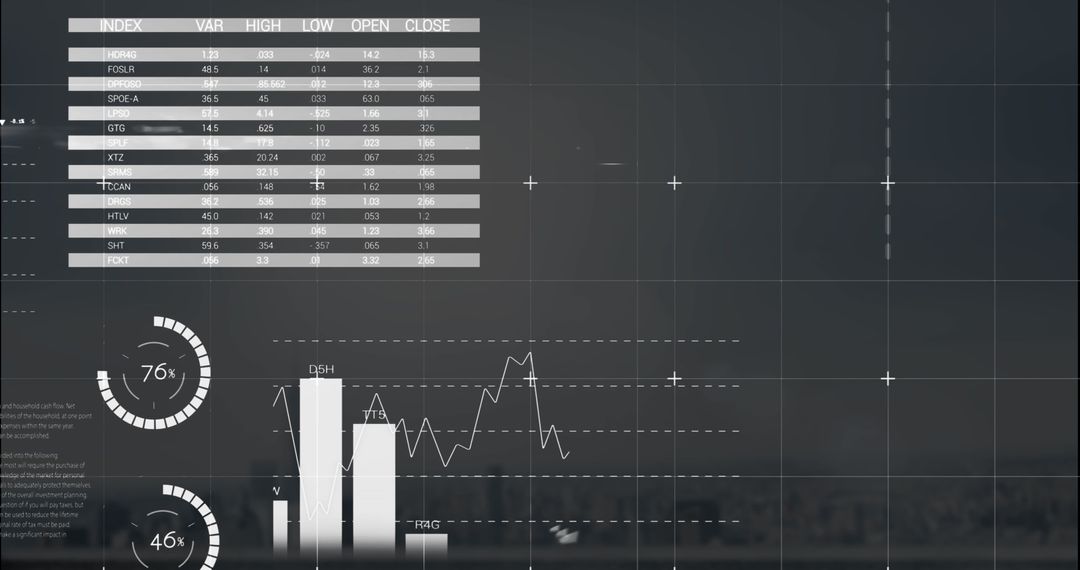
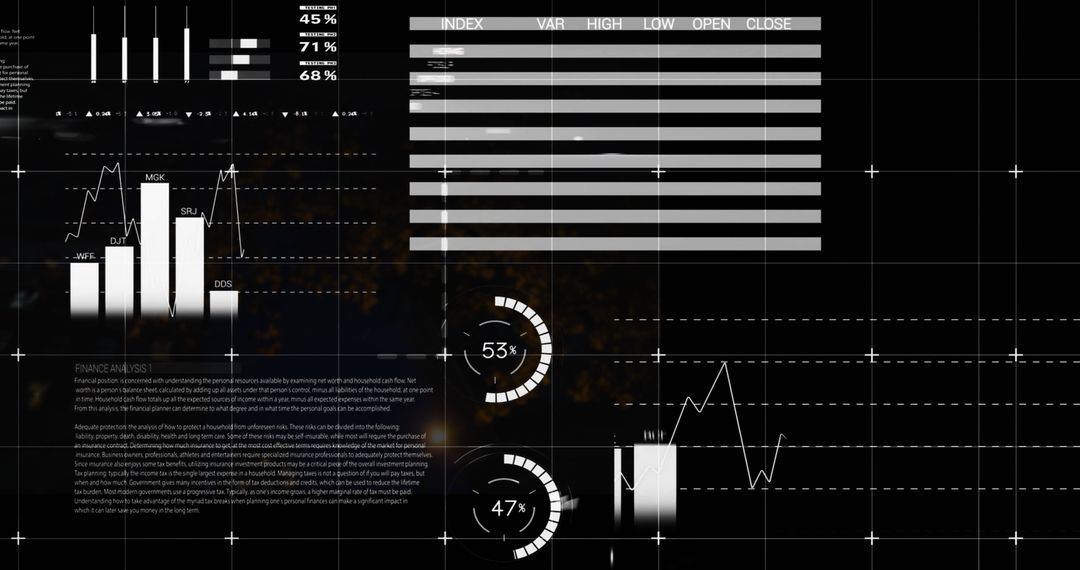
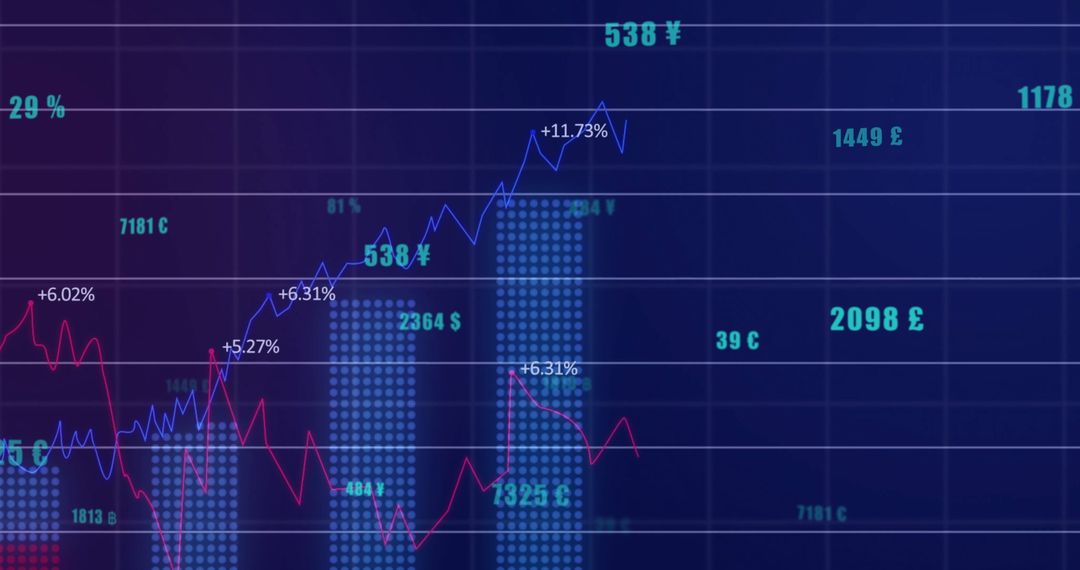
- Digital Stock Market Data Interface with Charts and Graphs
Digital Stock Market Data Interface with Charts and Graphs Image

This abstract digital illustration shows intricate data processing charts and graphs against a world map backdrop, representing global technology and financial analytics. Ideal for use in presentations, websites, or articles focused on finance, investments, technology, or data analysis as it emphasizes international connections and digital transformation.
Powered by  - Get 15% off with code: PIKWIZARD15


2
downloads
downloads
Tags:
More
Credit Photo
If you would like to credit the Photo, here are some ways you can do so
Text Link
photo Link
<span class="text-link">
<span>
<a target="_blank" href=https://pikwizard.com/photo/digital-stock-market-data-interface-with-charts-and-graphs/b11b6b1d4620871a0c85e84e91b18c99/>PikWizard</a>
</span>
</span>
<span class="image-link">
<span
style="margin: 0 0 20px 0; display: inline-block; vertical-align: middle; width: 100%;"
>
<a
target="_blank"
href="https://pikwizard.com/photo/digital-stock-market-data-interface-with-charts-and-graphs/b11b6b1d4620871a0c85e84e91b18c99/"
style="text-decoration: none; font-size: 10px; margin: 0;"
>
<img src="https://pikwizard.com/pw/medium/b11b6b1d4620871a0c85e84e91b18c99.jpg" style="margin: 0; width: 100%;" alt="" />
<p style="font-size: 12px; margin: 0;">PikWizard</p>
</a>
</span>
</span>
Free (free of charge)
Free for personal and commercial use.
Author: Awesome Content
Similar Free Stock Images

Premium


Premium


Premium


Premium


Premium


Premium


Premium


Premium


Premium


Premium


Premium


Premium


Premium


Premium


Premium


Premium


Premium


Premium


Premium


Premium


Premium


Premium


Premium


Premium