
- Home >
- Stock Photos >
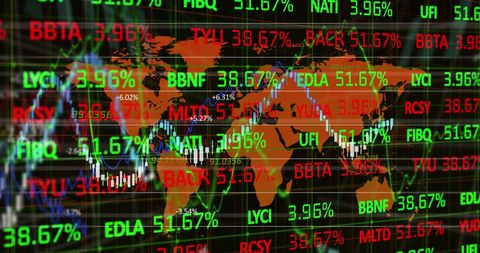
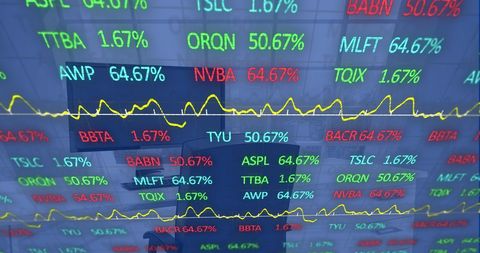
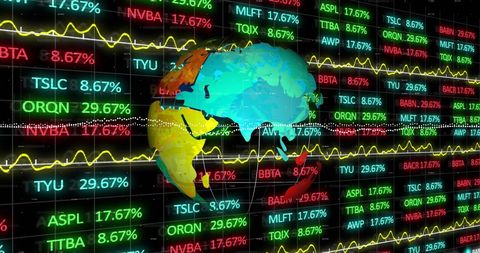
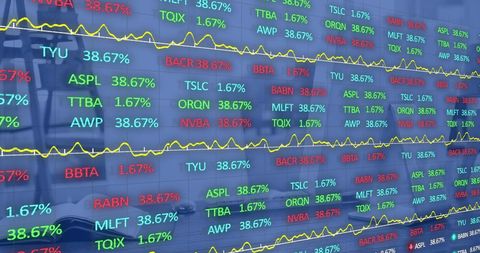
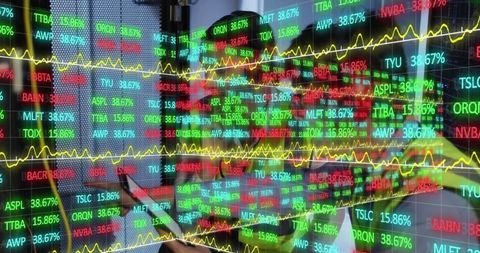
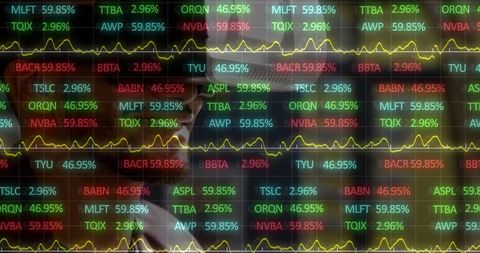
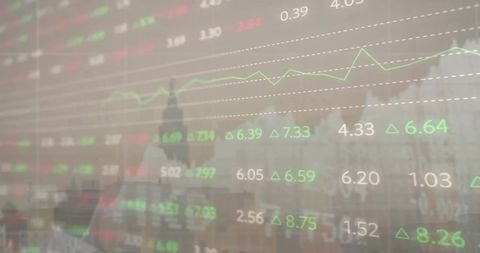
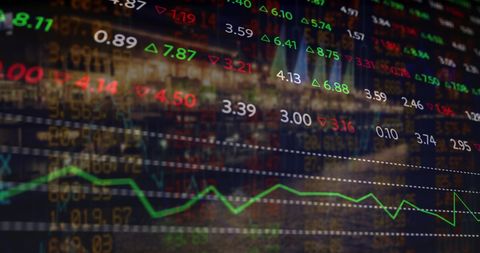
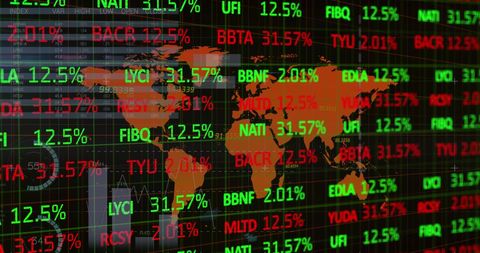
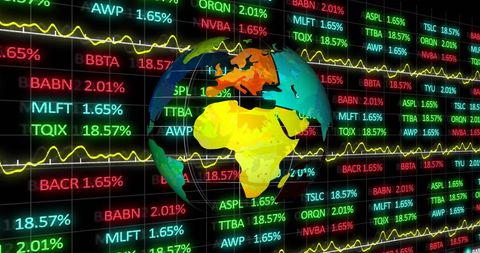
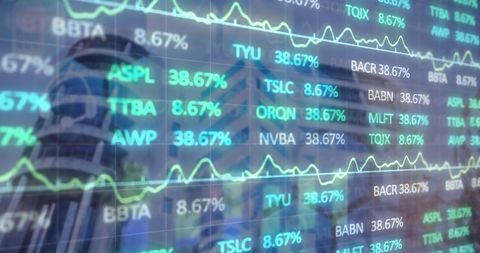
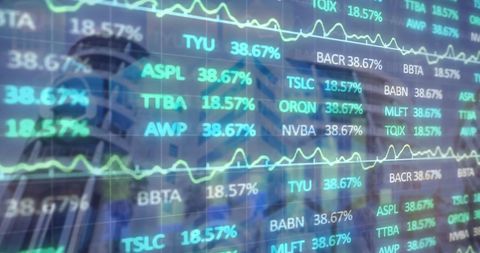
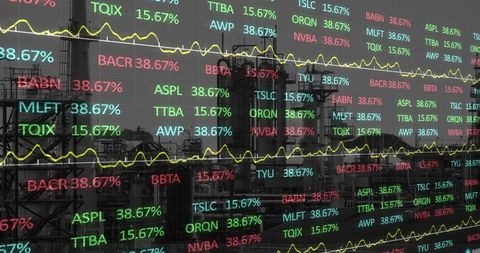
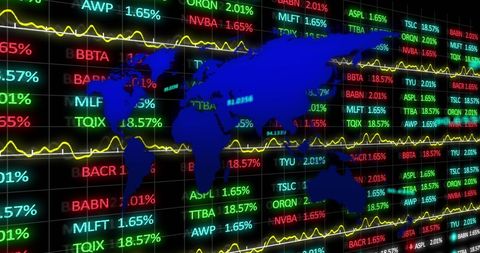
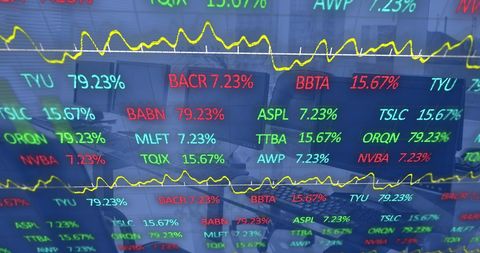
- Digital Stock Market Data on Multiple Trading Screens
Digital Stock Market Data on Multiple Trading Screens Image

AI
AI Generated Image. Shows various computer screens with financial stock market data, illustrating the complex and fast-paced world of digital trading. Ideal for use in articles and materials related to global business, technology in finance, and trading education. Can enhance websites, brochures, or reports focused on financial technology advancements or investments.
Powered by  - Get 15% off with code: PIKWIZARD15


downloads
Tags:
More
Credit Photo
If you would like to credit the Photo, here are some ways you can do so
Text Link
photo Link
<span class="text-link">
<span>
<a target="_blank" href=https://pikwizard.com/photo/digital-stock-market-data-on-multiple-trading-screens/d0cb75f86f50bc8ba4eac08caaf0d2ef/>PikWizard</a>
</span>
</span>
<span class="image-link">
<span
style="margin: 0 0 20px 0; display: inline-block; vertical-align: middle; width: 100%;"
>
<a
target="_blank"
href="https://pikwizard.com/photo/digital-stock-market-data-on-multiple-trading-screens/d0cb75f86f50bc8ba4eac08caaf0d2ef/"
style="text-decoration: none; font-size: 10px; margin: 0;"
>
<img src="https://pikwizard.com/pw/medium/d0cb75f86f50bc8ba4eac08caaf0d2ef.jpg" style="margin: 0; width: 100%;" alt="" />
<p style="font-size: 12px; margin: 0;">PikWizard</p>
</a>
</span>
</span>
Free (free of charge)
Free for personal and commercial use.
Author: AI Creator
Similar Free Stock Images

Premium


Premium


Premium


Premium


AI

AI


Premium


Premium

Premium

AI


Premium


AI


Premium


Premium

Premium


Premium

Premium


AI

AI


Premium


Premium


Premium

Premium


Premium


Premium

Premium

Premium

Premium


Premium


AI

Premium


Premium

Explore More Free Stock Images