- Home >
- Stock Photos >
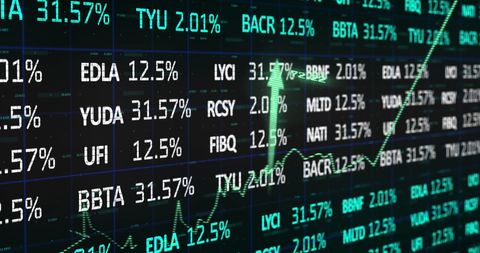
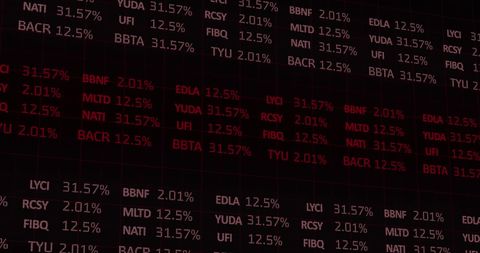
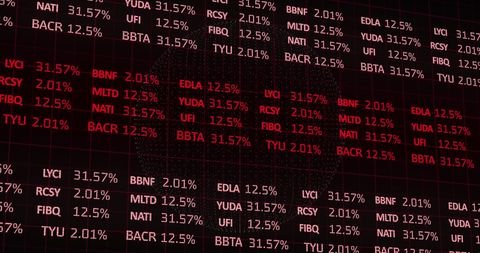
- Digital Stock Market Data Visualization on Black Background
Digital Stock Market Data Visualization on Black Background Image
Digital representation of stock market data with percentages and symbols in red on black background. Useful for illustrating concepts related to finance, data analysis, investment strategies, and the fluctuations of global markets.

downloads
Tags:
More
Credit Photo
If you would like to credit the Photo, here are some ways you can do so
Text Link
photo Link
<span class="text-link">
<span>
<a target="_blank" href=https://pikwizard.com/photo/digital-stock-market-data-visualization-on-black-background/42599e30ee1a1f16d72f2fe1a254ab3d/>PikWizard</a>
</span>
</span>
<span class="image-link">
<span
style="margin: 0 0 20px 0; display: inline-block; vertical-align: middle; width: 100%;"
>
<a
target="_blank"
href="https://pikwizard.com/photo/digital-stock-market-data-visualization-on-black-background/42599e30ee1a1f16d72f2fe1a254ab3d/"
style="text-decoration: none; font-size: 10px; margin: 0;"
>
<img src="https://pikwizard.com/pw/medium/42599e30ee1a1f16d72f2fe1a254ab3d.jpg" style="margin: 0; width: 100%;" alt="" />
<p style="font-size: 12px; margin: 0;">PikWizard</p>
</a>
</span>
</span>
Free (free of charge)
Free for personal and commercial use.
Author: Creative Art