
- Home >
- Stock Photos >
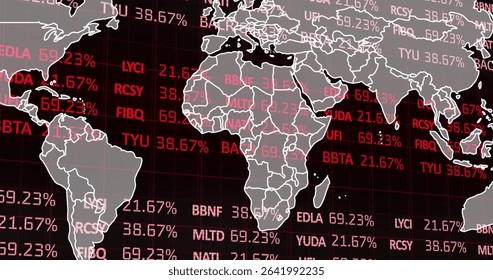
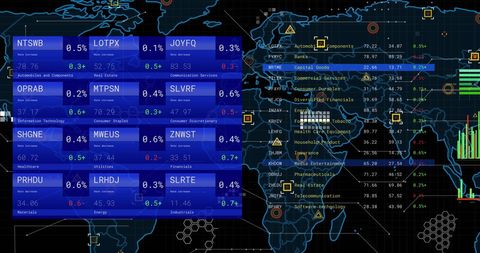
- Digital Stock Market Data Visualization Over World Map
Digital Stock Market Data Visualization Over World Map Image

Dynamic visual of stock market trends represented with graphs and digital data over a world map. Ideal for illustrating global financial analytics, trading strategies, and economic forecasting presentations. Useful for business blogs, educational articles on investing, or technology news about data visualization.
Powered by  - Get 15% off with code: PIKWIZARD15


downloads
Tags:
More
Credit Photo
If you would like to credit the Photo, here are some ways you can do so
Text Link
photo Link
<span class="text-link">
<span>
<a target="_blank" href=https://pikwizard.com/photo/digital-stock-market-data-visualization-over-world-map/4850141aa64fbdefa3b3d155c16a4018/>PikWizard</a>
</span>
</span>
<span class="image-link">
<span
style="margin: 0 0 20px 0; display: inline-block; vertical-align: middle; width: 100%;"
>
<a
target="_blank"
href="https://pikwizard.com/photo/digital-stock-market-data-visualization-over-world-map/4850141aa64fbdefa3b3d155c16a4018/"
style="text-decoration: none; font-size: 10px; margin: 0;"
>
<img src="https://pikwizard.com/pw/medium/4850141aa64fbdefa3b3d155c16a4018.jpg" style="margin: 0; width: 100%;" alt="" />
<p style="font-size: 12px; margin: 0;">PikWizard</p>
</a>
</span>
</span>
Free (free of charge)
Free for personal and commercial use.
Author: Creative Art
Similar Free Stock Images

Premium


Premium

Premium


Premium


Premium


Premium


Premium

Premium

Premium


Premium

Premium

Premium


Premium

Premium


Premium


Premium


Premium


Premium


Premium


Premium


Premium


Premium

Premium

Premium


Premium


Explore More Free Stock Images