- Home >
- Stock Photos >
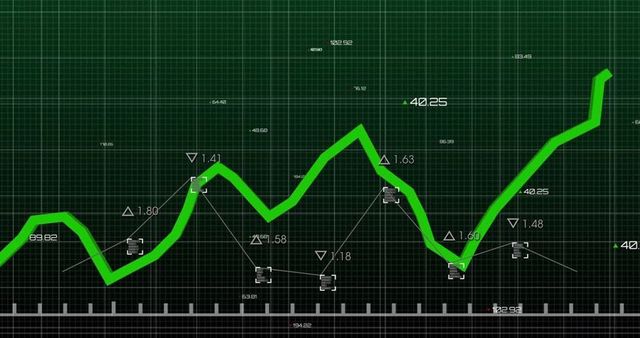
- Digital Stock Market Data Visualization with Binary Interface
Digital Stock Market Data Visualization with Binary Interface Image

Illustrates technology-driven stock market data analysis. Useful for presentations on financial technology, illustrating concepts of real-time trading, electronic finance platforms. Ideal for articles or websites focused on modern analytics and investment strategies.

downloads
Tags:
More
Credit Photo
If you would like to credit the Photo, here are some ways you can do so
Text Link
photo Link
<span class="text-link">
<span>
<a target="_blank" href=https://pikwizard.com/photo/digital-stock-market-data-visualization-with-binary-interface/1c9e34e057c0ef9d5901e71afc66d5a0/>PikWizard</a>
</span>
</span>
<span class="image-link">
<span
style="margin: 0 0 20px 0; display: inline-block; vertical-align: middle; width: 100%;"
>
<a
target="_blank"
href="https://pikwizard.com/photo/digital-stock-market-data-visualization-with-binary-interface/1c9e34e057c0ef9d5901e71afc66d5a0/"
style="text-decoration: none; font-size: 10px; margin: 0;"
>
<img src="https://pikwizard.com/pw/medium/1c9e34e057c0ef9d5901e71afc66d5a0.jpg" style="margin: 0; width: 100%;" alt="" />
<p style="font-size: 12px; margin: 0;">PikWizard</p>
</a>
</span>
</span>
Free (free of charge)
Free for personal and commercial use.
Author: Creative Art