- Home >
- Stock Photos >
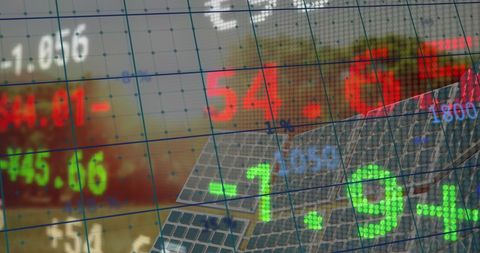
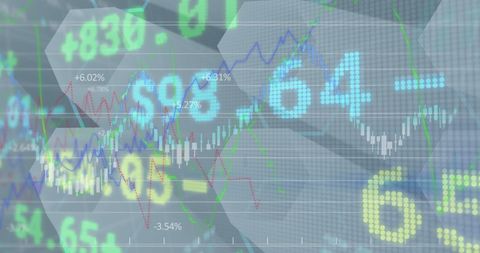
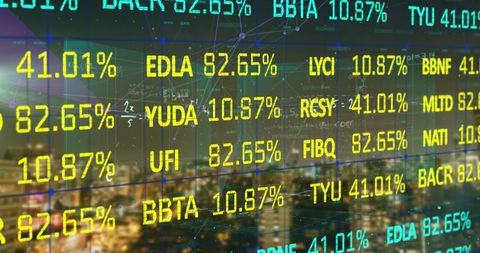
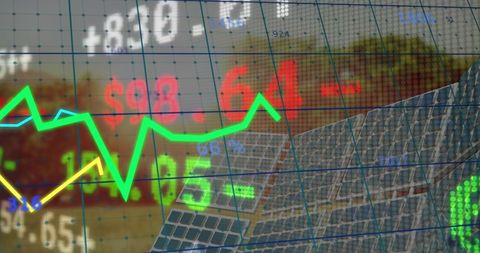
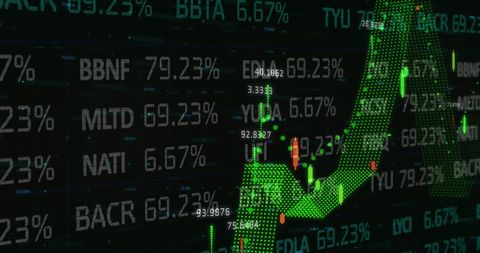
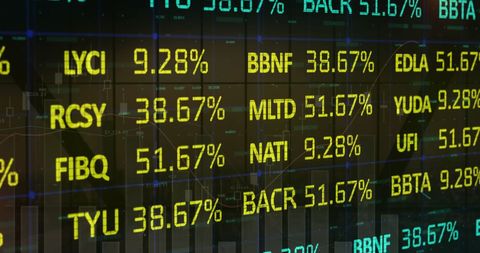
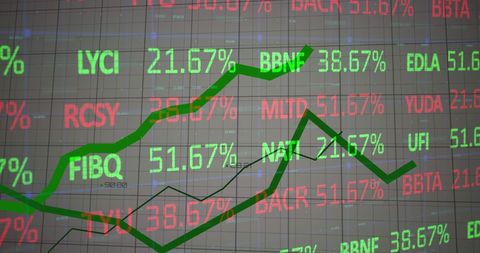
- Digital Stock Market Data Visualization with Financial Graphs
Digital Stock Market Data Visualization with Financial Graphs Image

Visual representation of fluctuating stock values and financial data projections. Useful for presentations on financial trading, market trends, economic analysis, or technology in finance sectors. Ideal for digital platforms discussing global finance success and challenges.

downloads
Tags:
More
Credit Photo
If you would like to credit the Photo, here are some ways you can do so
Text Link
photo Link
<span class="text-link">
<span>
<a target="_blank" href=https://pikwizard.com/photo/digital-stock-market-data-visualization-with-financial-graphs/6a2fd1f1dc442c5ce570e5161e331e67/>PikWizard</a>
</span>
</span>
<span class="image-link">
<span
style="margin: 0 0 20px 0; display: inline-block; vertical-align: middle; width: 100%;"
>
<a
target="_blank"
href="https://pikwizard.com/photo/digital-stock-market-data-visualization-with-financial-graphs/6a2fd1f1dc442c5ce570e5161e331e67/"
style="text-decoration: none; font-size: 10px; margin: 0;"
>
<img src="https://pikwizard.com/pw/medium/6a2fd1f1dc442c5ce570e5161e331e67.jpg" style="margin: 0; width: 100%;" alt="" />
<p style="font-size: 12px; margin: 0;">PikWizard</p>
</a>
</span>
</span>
Free (free of charge)
Free for personal and commercial use.
Author: Awesome Content