- Home >
- Stock Photos >
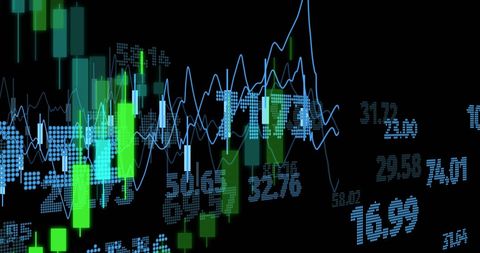
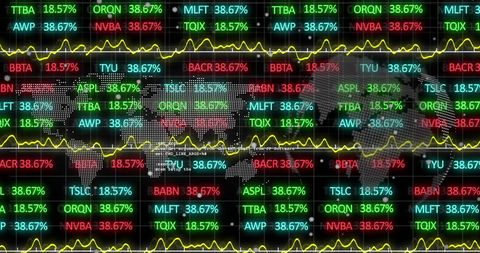
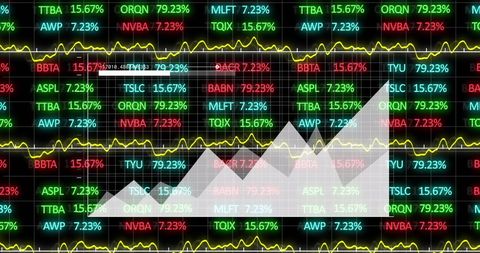
- Digital Stock Market Data Visualization with Graphs
Digital Stock Market Data Visualization with Graphs Image

Colorful stock market graphs and data charts highlight the economic landscape and business analytics. Perfect for use in publications or presentations explaining concepts in finance, educational materials examining market trends, or business strategists showcasing investment insights.

downloads
Tags:
More
Credit Photo
If you would like to credit the Photo, here are some ways you can do so
Text Link
photo Link
<span class="text-link">
<span>
<a target="_blank" href=https://pikwizard.com/photo/digital-stock-market-data-visualization-with-graphs/9566833845b1de46be05fe69d9b0c703/>PikWizard</a>
</span>
</span>
<span class="image-link">
<span
style="margin: 0 0 20px 0; display: inline-block; vertical-align: middle; width: 100%;"
>
<a
target="_blank"
href="https://pikwizard.com/photo/digital-stock-market-data-visualization-with-graphs/9566833845b1de46be05fe69d9b0c703/"
style="text-decoration: none; font-size: 10px; margin: 0;"
>
<img src="https://pikwizard.com/pw/medium/9566833845b1de46be05fe69d9b0c703.jpg" style="margin: 0; width: 100%;" alt="" />
<p style="font-size: 12px; margin: 0;">PikWizard</p>
</a>
</span>
</span>
Free (free of charge)
Free for personal and commercial use.
Author: People Creations