- Home >
- Stock Photos >
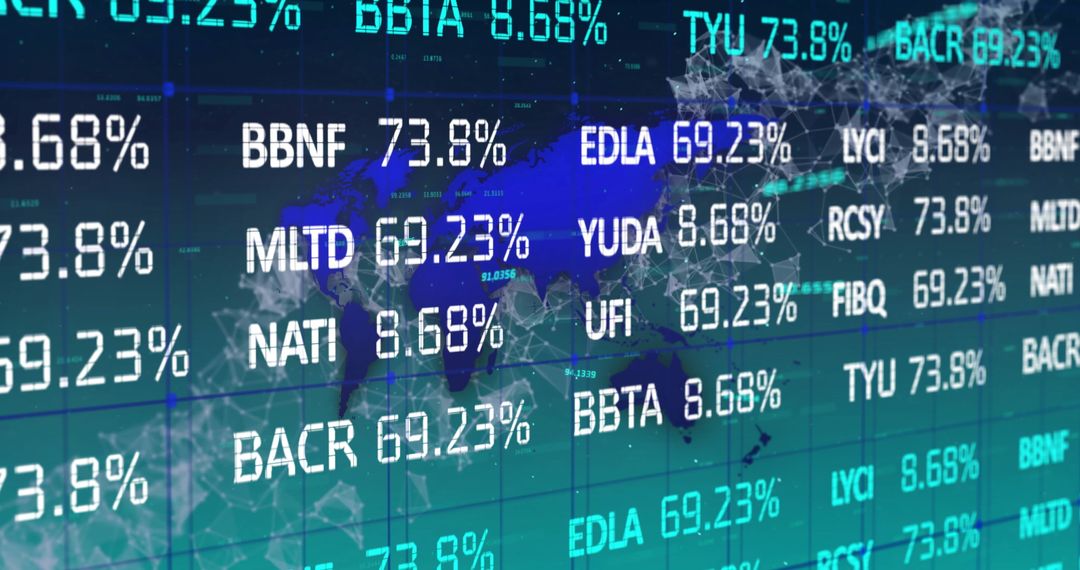
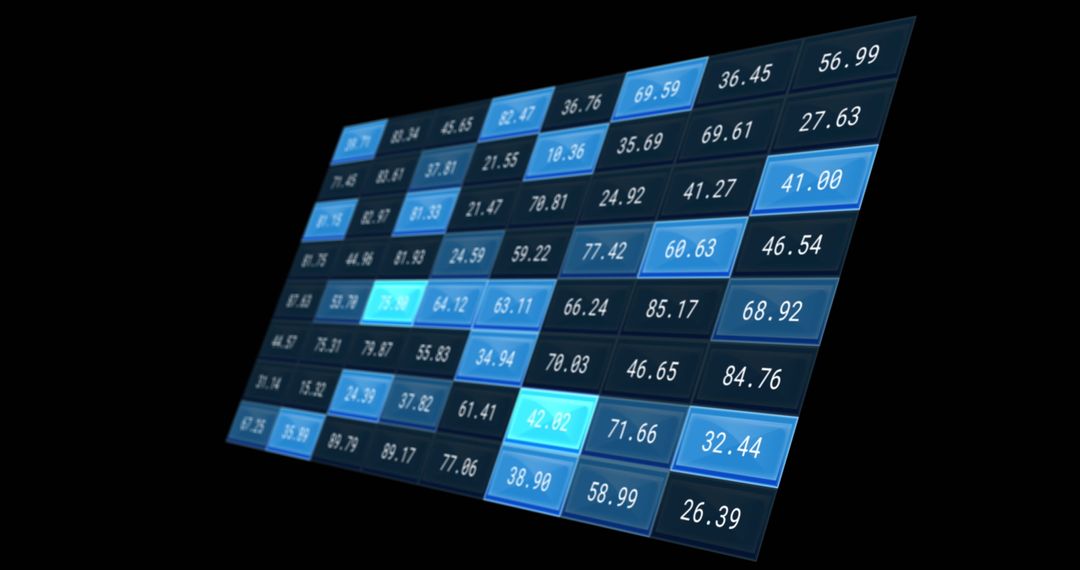
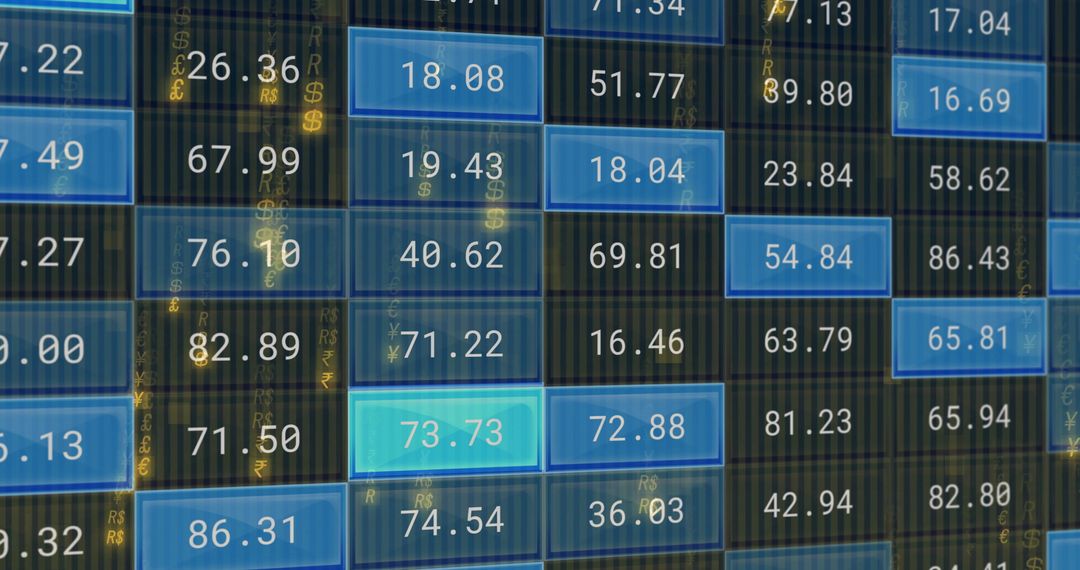
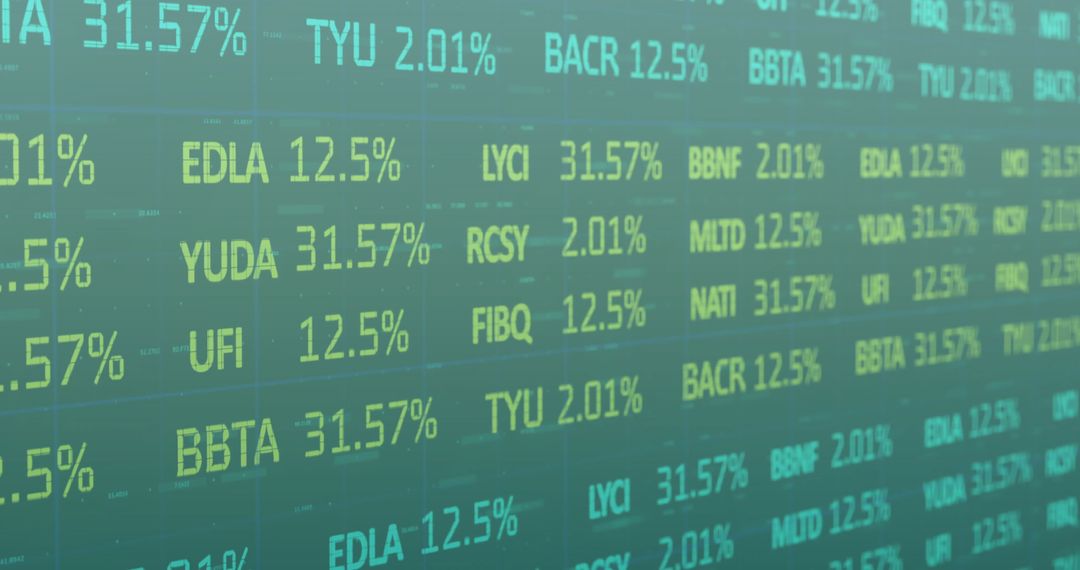
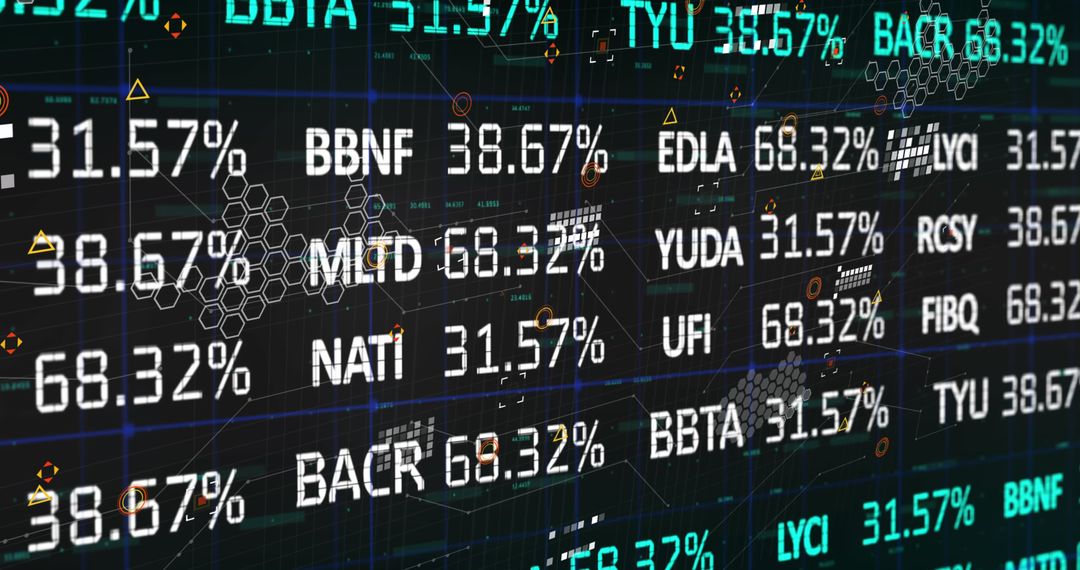
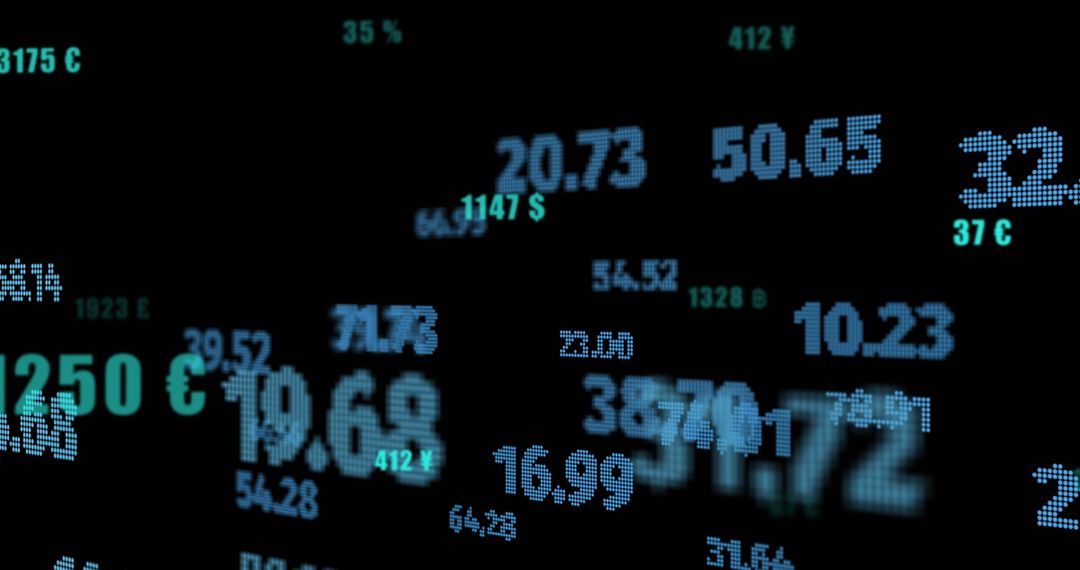
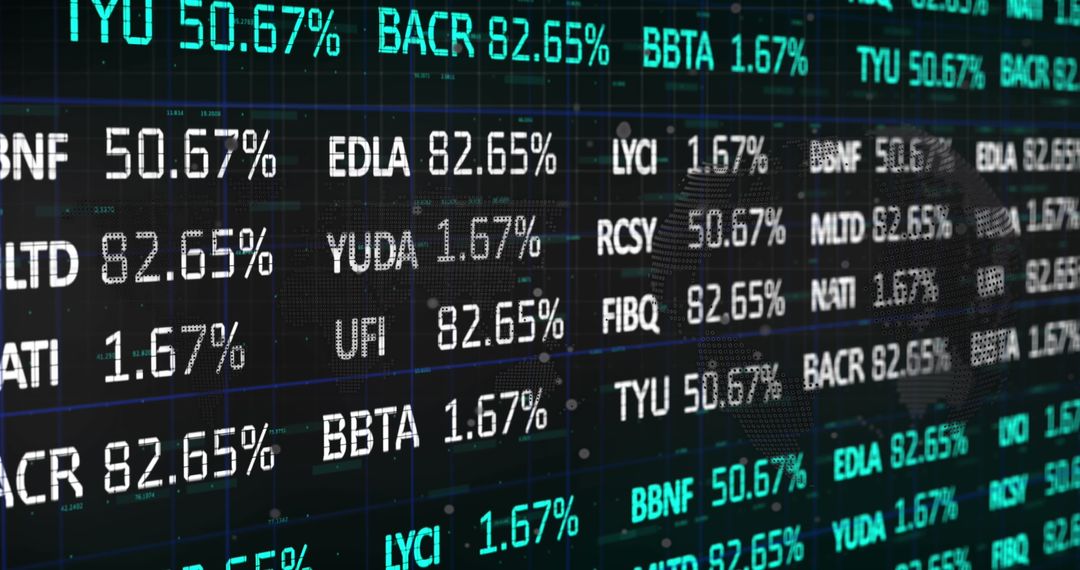
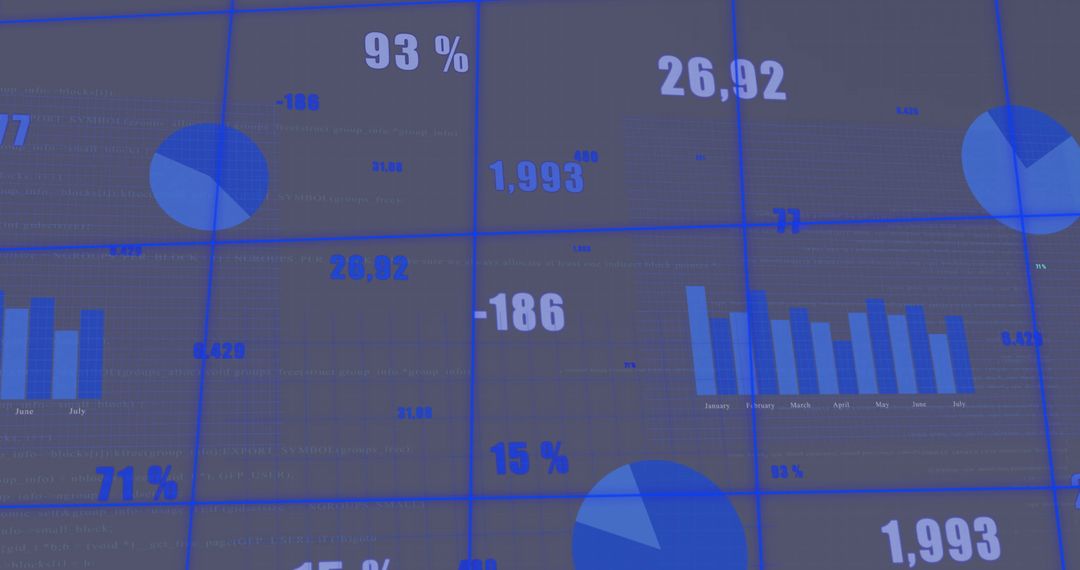
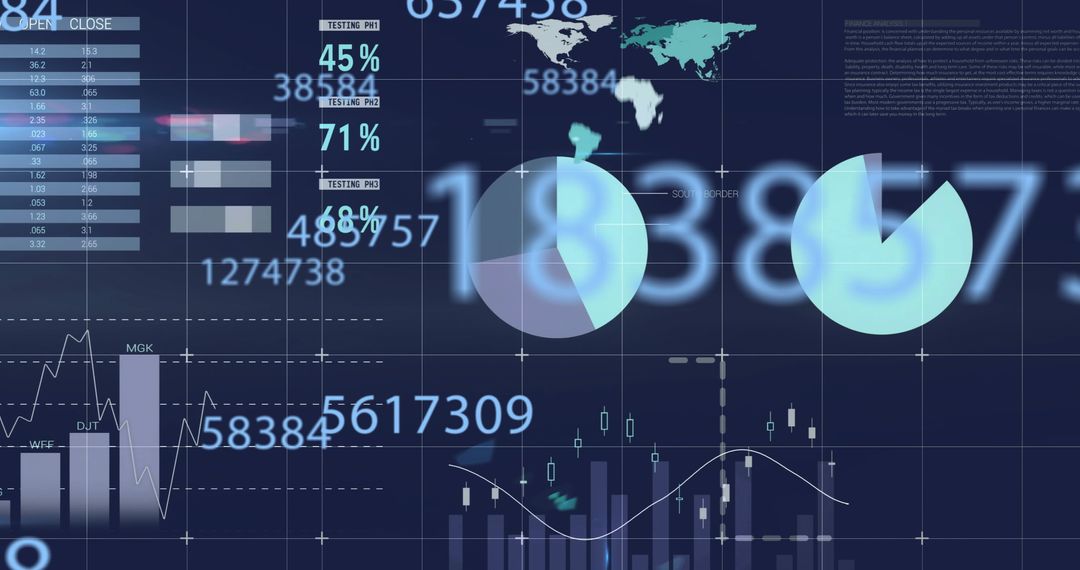
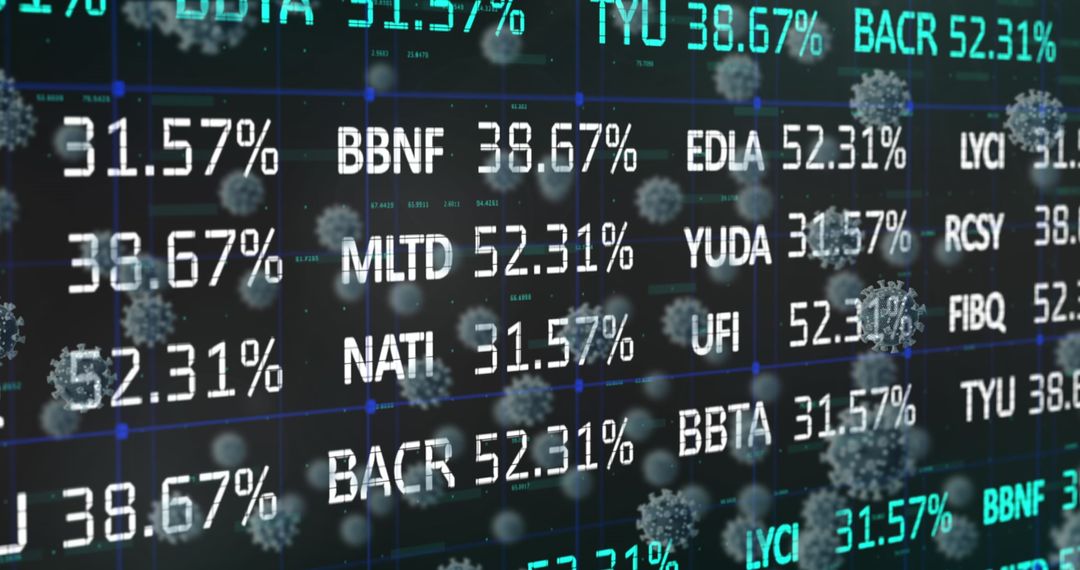
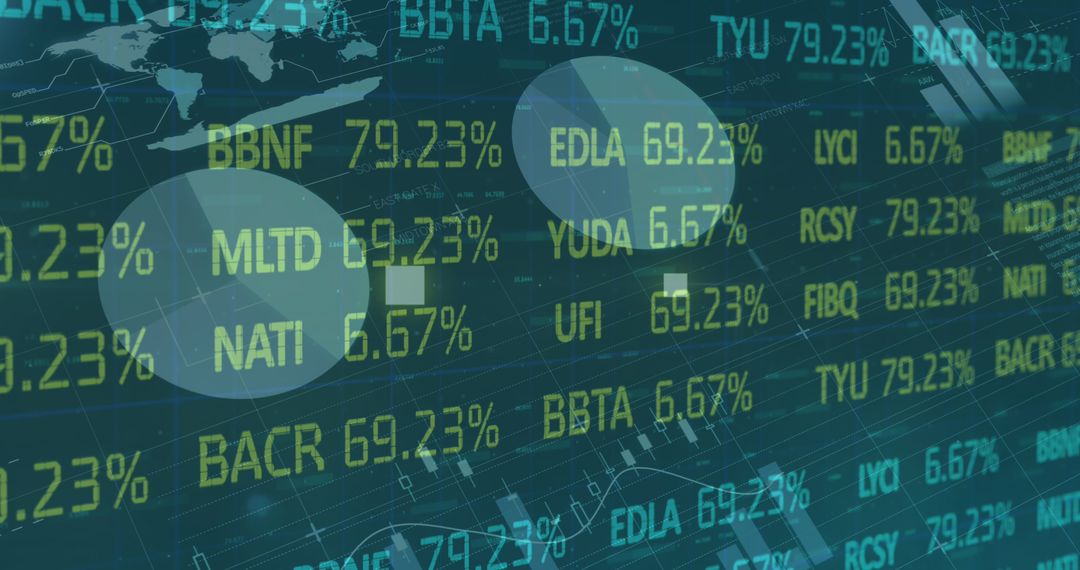
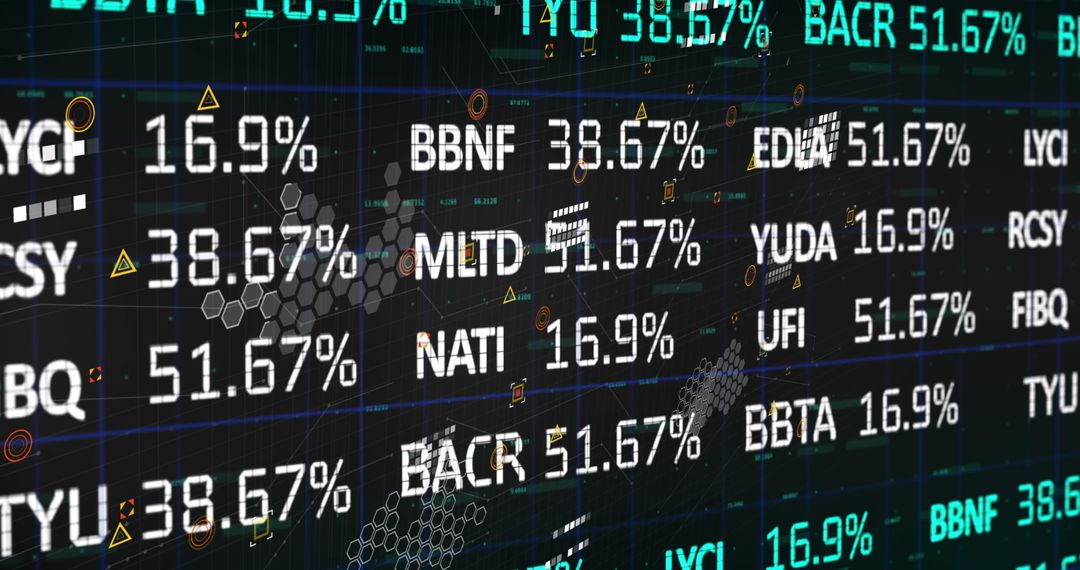
- Digital Stock Market Display with Data Analysis Dashboard
Digital Stock Market Display with Data Analysis Dashboard Image

This depicts digital representation of stock market data with numbers and graphs on a dark background. It is useful for articles and websites focused on financial trends, data analysis, economic forecasts, and technology use in finance. Ideal for presentations on how global networks operate in brokerage services and digital financial marketplaces.
Powered by  - Get 15% off with code: PIKWIZARD15


2
downloads
downloads
Tags:
More
Credit Photo
If you would like to credit the Photo, here are some ways you can do so
Text Link
photo Link
<span class="text-link">
<span>
<a target="_blank" href=https://pikwizard.com/photo/digital-stock-market-display-with-data-analysis-dashboard/49d4b8c129f8194a986996d7060df711/>PikWizard</a>
</span>
</span>
<span class="image-link">
<span
style="margin: 0 0 20px 0; display: inline-block; vertical-align: middle; width: 100%;"
>
<a
target="_blank"
href="https://pikwizard.com/photo/digital-stock-market-display-with-data-analysis-dashboard/49d4b8c129f8194a986996d7060df711/"
style="text-decoration: none; font-size: 10px; margin: 0;"
>
<img src="https://pikwizard.com/pw/medium/49d4b8c129f8194a986996d7060df711.jpg" style="margin: 0; width: 100%;" alt="" />
<p style="font-size: 12px; margin: 0;">PikWizard</p>
</a>
</span>
</span>
Free (free of charge)
Free for personal and commercial use.
Author: Awesome Content
Similar Free Stock Images
Premium


Premium


Premium


Premium


Premium


Premium


Premium


Premium


Premium


Premium


Premium


Premium


Premium


Premium


Premium


Premium


Premium


Premium


Premium


Premium


Premium


Premium


Premium


Premium