- Home >
- Stock Photos >
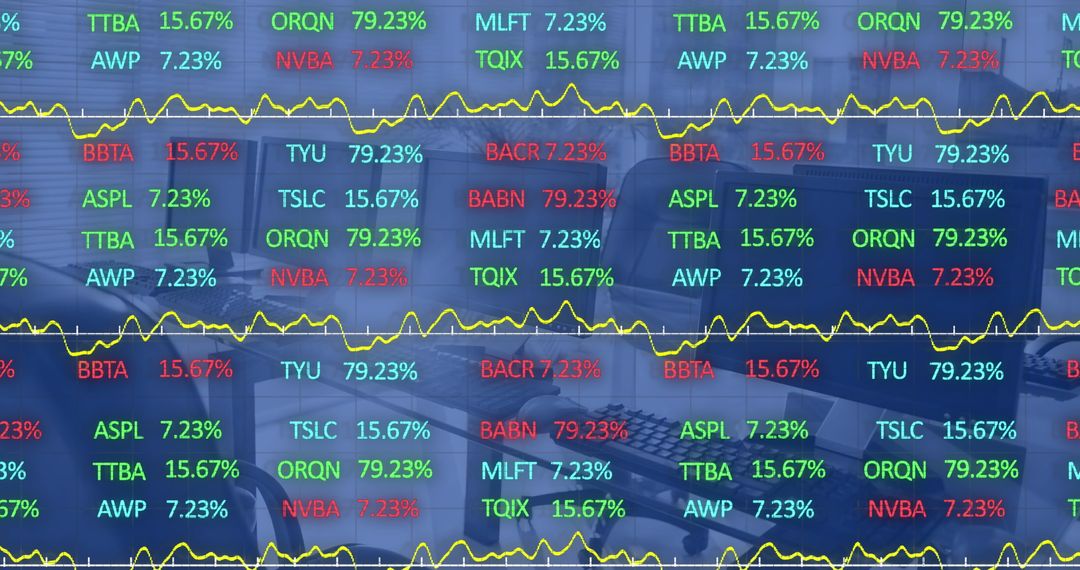
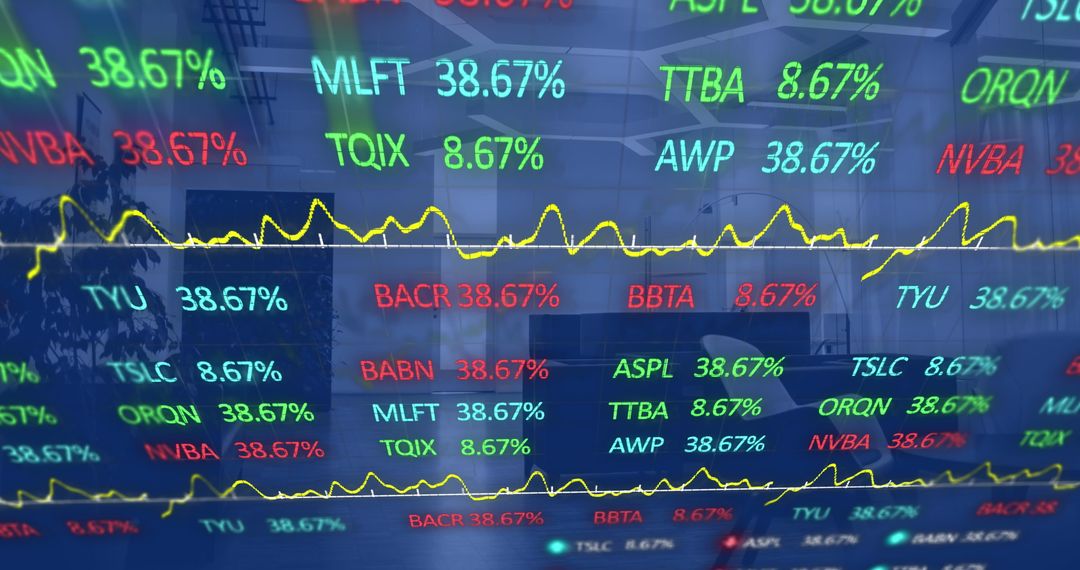
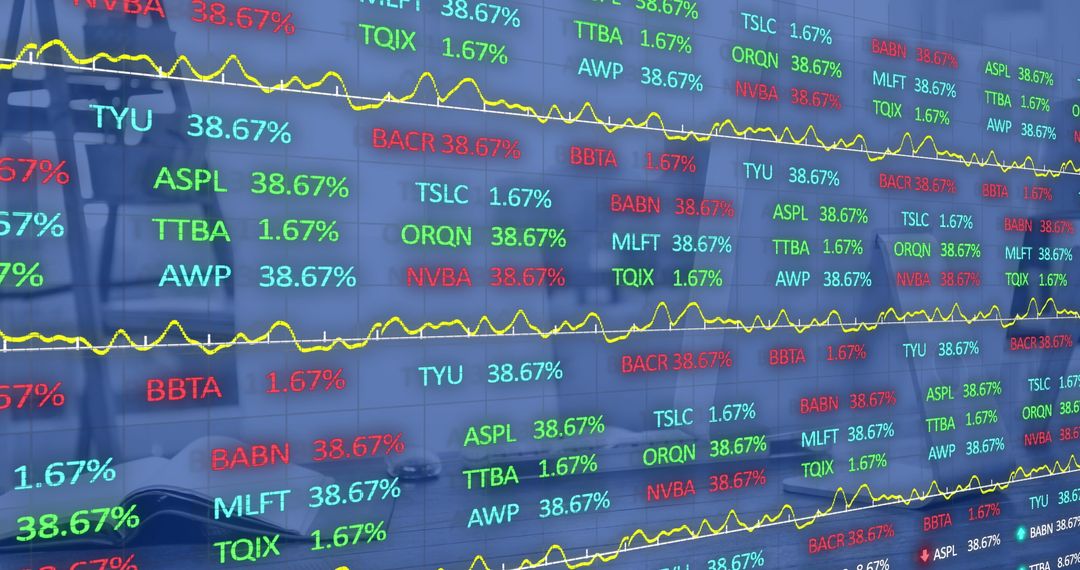
- Digital Stock Market Display with Graphs Analysis
Digital Stock Market Display with Graphs Analysis Image

This visual shows a digital display of a stock market trading board with red and green financial figures against a blue background, enhanced by white dots forming trend graphs. Ideal for illustrating articles, reports, and informational content about finance, stock trading, economics, investment strategies, and market analysis. Useful for improving the engagement of educational materials and presentations in economic and financial sectors.
Powered by 


2
downloads
downloads
Tags:
More
Credit Photo
If you would like to credit the Photo, here are some ways you can do so
Text Link
photo Link
<span class="text-link">
<span>
<a target="_blank" href=https://pikwizard.com/photo/digital-stock-market-display-with-graphs-analysis/dd6aa196ec31f2e9b9c0c507667d2925/>PikWizard</a>
</span>
</span>
<span class="image-link">
<span
style="margin: 0 0 20px 0; display: inline-block; vertical-align: middle; width: 100%;"
>
<a
target="_blank"
href="https://pikwizard.com/photo/digital-stock-market-display-with-graphs-analysis/dd6aa196ec31f2e9b9c0c507667d2925/"
style="text-decoration: none; font-size: 10px; margin: 0;"
>
<img src="https://pikwizard.com/pw/medium/dd6aa196ec31f2e9b9c0c507667d2925.jpg" style="margin: 0; width: 100%;" alt="" />
<p style="font-size: 12px; margin: 0;">PikWizard</p>
</a>
</span>
</span>
Free (free of charge)
Free for personal and commercial use.
Author: Authentic Images
Similar Free Stock Images

Premium


Premium


Premium


Premium


Premium


Premium


Premium


Premium


Premium


Premium


Premium


Premium


Premium


Premium


Premium


Premium


Premium


Premium


Premium


Premium


Premium


Premium


Premium


Premium