
- Home >
- Stock Photos >
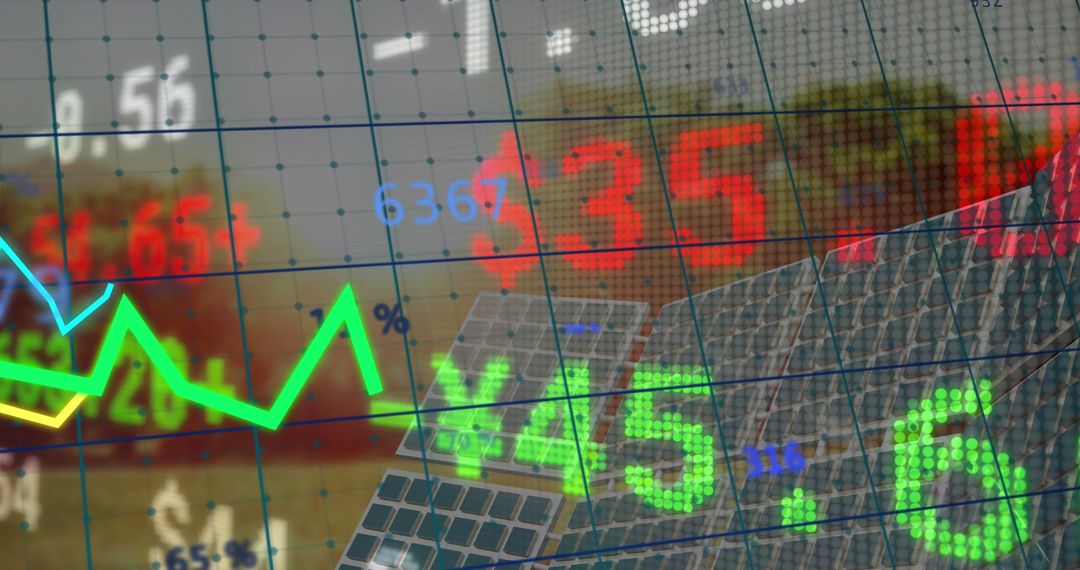
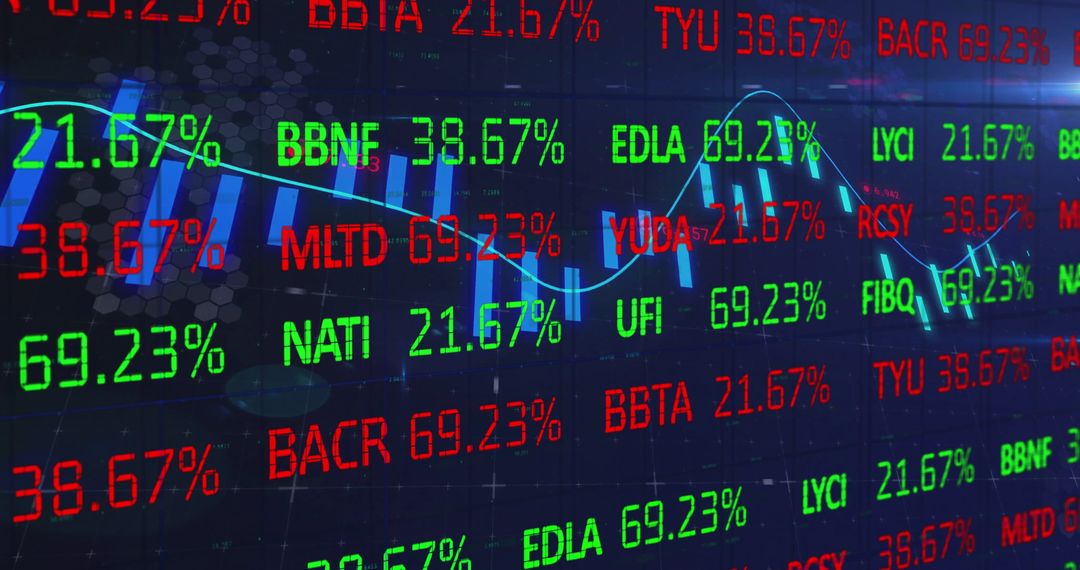
- Digital Stock Market Display with Graphs and Data Analytics
Digital Stock Market Display with Graphs and Data Analytics Image

Illustrates concepts of digital finance with overlapping graphs and stock market figures. Useful for presentations related to economic analysis, tech-driven finance solutions, and corporate decision-making processes.
Powered by  - Get 15% off with code: PIKWIZARD15


2
downloads
downloads
Tags:
More
Credit Photo
If you would like to credit the Photo, here are some ways you can do so
Text Link
photo Link
<span class="text-link">
<span>
<a target="_blank" href=https://pikwizard.com/photo/digital-stock-market-display-with-graphs-and-data-analytics/618794068f8a199f3308a042ffb29bff/>PikWizard</a>
</span>
</span>
<span class="image-link">
<span
style="margin: 0 0 20px 0; display: inline-block; vertical-align: middle; width: 100%;"
>
<a
target="_blank"
href="https://pikwizard.com/photo/digital-stock-market-display-with-graphs-and-data-analytics/618794068f8a199f3308a042ffb29bff/"
style="text-decoration: none; font-size: 10px; margin: 0;"
>
<img src="https://pikwizard.com/pw/medium/618794068f8a199f3308a042ffb29bff.jpg" style="margin: 0; width: 100%;" alt="" />
<p style="font-size: 12px; margin: 0;">PikWizard</p>
</a>
</span>
</span>
Free (free of charge)
Free for personal and commercial use.
Author: People Creations
Similar Free Stock Images

Premium


Premium


Premium


Premium


Premium


Premium


Premium


Premium


Premium


Premium


Premium


Premium


Premium


Premium


Premium


Premium


Premium


Premium


Premium


Premium


Premium


Premium


Premium


Premium

