1. Home > 
  2. Stock Photos > 
  3. Digital Stock Market Display With Numerical Data and Graphs

Digital Stock Market Display With Numerical Data and Graphs Image

Digital Stock Market Display With Numerical Data and Graphs

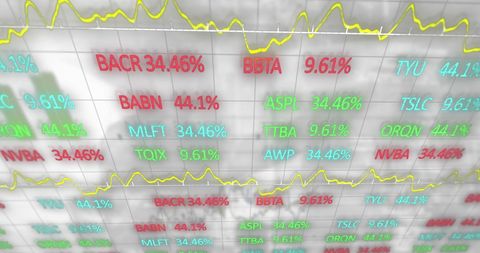
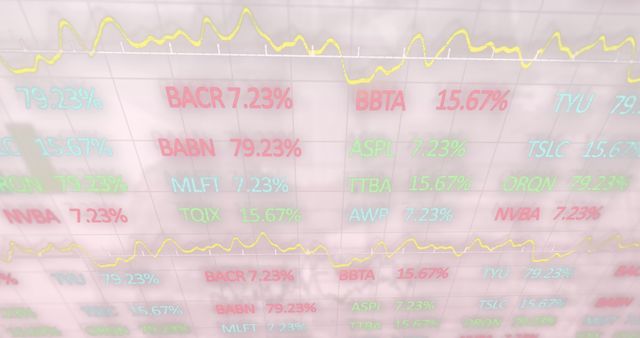
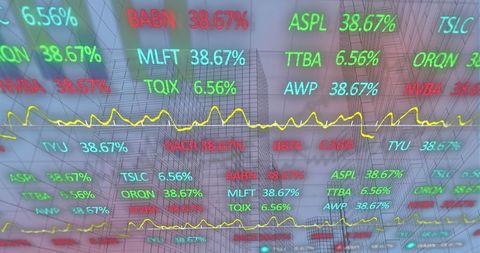
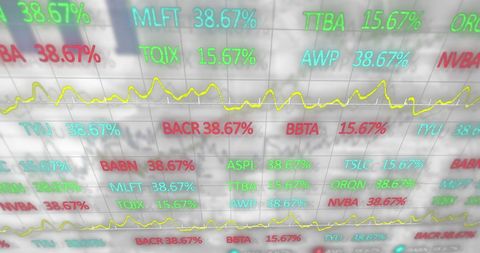
A display showcasing various stock percentages in colorful text alongside line graphs against a white background. Suitable for illustrating financial articles, investment strategy content, or educational resources about the stock market.

Powered by Shutterstock logo - Get 15% off with code: PIKWIZARD15
Smart businessman hand close up NFT financial data on mobile laptop futuristic stock chart graphic, Business investor stock exchange market and crypto currency data analytics digital technology - Powered by Shutterstock - Get 15% off with code: PIKWIZARD15Business analysis big data screen and economic growth with financial graph. Concept of virtual dashboard technology digital marketing and global economy network connection. 3D illustration. - Powered by Shutterstock - Get 15% off with code: PIKWIZARD15Online trading, Investment, Strategy market plan, and Stock mark - Powered by Shutterstock - Get 15% off with code: PIKWIZARD15Man look at the dashboard with graphs and charts. Concept of data management system, business intelligence, data statistics, marketing analysis, key performance indicators (KPI) and analytics. - Powered by Shutterstock - Get 15% off with code: PIKWIZARD15Business analysis big data screen and economic growth with financial graph. Concept of virtual dashboard technology digital marketing and global economy network connection. 3D illustration. - Powered by Shutterstock - Get 15% off with code: PIKWIZARD15

Credit Photo

If you would like to credit the Photo, here are some ways you can do so

Free (free of charge)

Free for personal and commercial use.

Author: Creative Art

Similar Free Stock Images

Loading...
Dynamic Stock Market Data Visual Collage
Premium
Man look at the dashboard with graphs and charts. Concept of data management system, business intelligence, data statistics, marketing analysis, key performance indicators (KPI) and analytics.
Abstract Financial Data and Cityscape City Light Overlay
Dynamic Stock Market Data With Digital Trading Analysis
Premium
Double exposure image of coin stacks on technology financial graph background.Economy trends background for business ,financial meltdown ,Cryptocurrency digital economy.
Digital Display of Stock Market Data Trends
Digital Financial Data on Vibrant Stock Market Display
Digital Stock Market Data Overlapping Business Meeting
Financial Data Display with Global Market Analysis
Premium
Business investment and metaverse AI artificial intelligence data analysis technology. Businessman and robot future investor, stock market, forex, and crypto currency NFT game finance investment.
Dynamic Display of Stock Market Statistics
Dynamic Financial Data Analysis on Digital Interface
Office Building Reflecting Pulsating Stock Market Data
Dynamic Stock Market Display Illustrating Financial Trends
Premium
Futuristic Digital Growth Chart – 3D Bar Graph with Glowing Blue Data Visualization
Global Business Interface with Stock Market Data Overlay
Digital Stock Market Display with Graphs and Data Overlay
Dynamic Stock Market Display with Rising Graphs and Key Indexes
Dynamic Financial Data Display on Electronic Grid
Premium
Businesswomen point to virtual screens of graph stock market changes in the global interface, uptrends, growth economic, business strategy development, and find opportunities for investment.
Dynamic Digital Stock Market Display and Analysis
Dynamic Stock Market Data Display on Digital Screen
Dynamic Stock Market Display with Real-Time Data
Dynamic Stock Market Data Overlay with Graph Lines
Premium
Hand pointing to financial data and market growth graphic report on screen
Premium
Displaying red and blue trend lines on analytics dashboard with percentage labels and code snippets. Finance, data visualization, technology, analytics, stock market, digital interface, investment
Financial Stock Market Data Analyzing Business Growth Trends
Financial Data Display with Stock Market Graphs Analysis
Digital Financial Data Display on Office Building Surface
Dynamic Financial Data Integrated with Urban Commerce Theme
Neon Green Stock Ticker Display Showing Live Percentages, Line Charts and Grid Data
Stock Market Financial Data and Chart Analysis
Green Stock Market Trends with Financial Growth Indicators
Stock Market Graphs and Binary Codes Overlay
Global Stock Market Analysis with Digital Interface
Dynamic Stock Market Data on Digital Screen
Digital Stock Market Finance Data Display with Statistical Graphs
Premium
Business man computer hand close up futuristic cyber space finance AI chatbot artificial coding coding background business data analytics programming online network metaverse digital world technology
Dynamic Stock Market Data Displayed on Monitors
Dynamic Digital Stock Market Trends Liaised with Graphics
Silhouettes Overlaid with Dynamic Stock Market Data
Global Data Processing with Stock Market Visualization Overlay
Premium
Man holding blue holographic globe with nodes connected around earth. Concept of global network connection, communication, fintech, data exchange, worldwide exchange of information and online banking.
Premium
A professional businessman showcases stock market data through a digital interface, set against a modern city backdrop, emphasizing the importance of financial analysis in investment strategies.
Global Stock Market Trends with Digital Graphs and Data
Digital Financial Data Display with Graphs and Market Trends
Glowing Stock Market Data and Interactive Graphs in Office
Analyzing Financial Data with Smartphone in Modern Workspace
Premium
Big Data Technology for Business Finance Analytic Concept. Modern graphic interface shows massive information of business sale report, profit chart and stock market trends analysis on screen monitor.
Financial Data Analytics Overlay on Team in Modern Office
Financial Data Analysis with Digital Overlay Shows Global Trends
Digital Visualization of Global Stock Market Dynamics
Financial Data Processing on Digital Screen Visualization
Dynamic Stock Market Ticker Display With Charts
Financial Data Processing with Cityscape Overlay
Digital Financial Data Processing and Stock Market Analysis Visualization
Dynamic Stock Market Data Visualization with Colorful Indicators
Financial Data Visualization in Global Business Technology Background
Global Financial Data Display over Digital Interface Globe
Global Stock Market Data with Nature Overlay
Digital Stock Market Data Projection on Office Building
Premium
Businessman's Hand Holding Holographic Stock Market Growth Chart with Green Arrow Showing Positive Financial Trends and Stock Candlestick Data on Digital Interface and Finance
Premium
businessman hand touch graph interface Buying shares in the stock market Financial data analysis, timely acquisition, stock acquisition ideas of companies with growing businesses in the future.
Global Financial Data Network Interface Concept Visualization
Digital Financial Data Overlaid on Cityscape, Abstract Technology Background
Premium
Business concept photo.Businessman working investment project modern office.Touching pad contemporary laptop. Worldwide connection technology,stock exchanges graphics interface. Horizontal
Premium
Man technology future lifestyle, digital marketing IOT internet of thing future AI chatbot technology smart device social network, VPN cybersecurity internet futuristic metaverse NFT background
Dynamic Financial Data Display with Stock Graphs and Figures
Futuristic Digital Financial Data Analysis
Dynamic Stock Market Ticker Displaying Financial Data Fluctuations
Financial Data on Digital Display Highlighting Global Market Trends
Financial Data Overlay with Hands Holding Smartphone
Abstract Digital Stock Market Interface with Data Processing
Financial Data with Factory Setup and Conveyor Belt Concept
Abstract Financial Data on Black Background Displaying Stock Market Trends
Digital Stock Market Display with Trend Analysis
Dynamic Financial Stock Market Dashboard with Data Analytics
Global Digital Interface with Financial Data Visualization
Financial Trading Board with Graphs and Office Atmosphere
Premium
Businessman using futuristic user interface with virtual data analytics. Innovative dashboard with financial charts, graphs, and global network information for business intelligence.
Overlay of Financial Data in Modern Office Background
Holographic Digital Stock Market Display with Graphs
Dynamic Display of Stock Market Data with Graph Lines
Financial Data with Statistics and Market Trends Overlay
Premium
Multi exposure of virtual abstract financial graph interface on modern interior background, financial and trading concept
Premium
Woman hold smartphone use pc at workplace. Project stats financial data sales charts on laptop and cellphone screen, close up view over shoulder. Report preparation, synchronization for safety concept
Premium
Businessman points a graph depicting the growth of business, data analysis in shaping a thriving global enterprise of blockchain technology and strategic planning in the modern business
World Economy and Financial Graphs on Digital Display
Financial Data Display on Digital Grid Interface Technology
Digital Financial Data Display Screen with Stock Trends
Stock Market Volatility Display with Detailed Statistics
Premium
Diverse Modern Office: Motivated Latin Businessman Leads Business Meeting with Managers, Talks about Company Growth, Uses TV for Presentation. Creative Digital Entrepreneurs Work on e-Commerce Project
Dynamic Digital Financial Data Display with Analytics
Dynamic Stock Market Screenshot with Tickers and Growth Percentages
Stock Market Tickers with Dynamic Graphs on Black Background
Financial Data Visualization on Server Background
Dynamic Stock Market Analysis with Colorful Ticker Display
Stock Market Data Financial Analysis Technology
Dynamic Stock Market Display Amid City Lights
Digital Financial Data Analysis in Global Business Finance
Digital Stock Market Display with Financial Index Trends
Premium
Businessman pointing chart financial goals and economic business planning global.
Premium
Showing digital market display scrolling stock symbols on dark grid, with yellow line graphs. Financial technology, data visualization, stock market analysis, trading platform, digital interface,
Digital Fintech Interface with Global Business Network
Dynamic Display of Stock Market Data and Fluctuating Graphs
Digital Stock Market Display with Financial Data Analysis
Stock Market Data Display with Office Reflections
Premium
Man Typing Keyboard Laptop Hand.Project Manager Researching Process.Business Team Working Startup modern Office.Global Strategy Virtual Icon.Innovation Graphs Interfaces.Analyze market stock.Blurred
Digital Financial Data Reflection in Modern Office Workspace
Stock Market Analysis with Network Connections and Data Visualization
Digital Interface and Stock Market Data with Blurred Hands Typing
Financial Data Analysis Over Modern Office Background
Premium
Business man using computer hand close up futuristic cyber space decentralized finance coding background, business data analytics programming online VPN network metaverse digital world technology
Dynamic Stock Market Analysis with Financial Data Visualization
Digital Data Analysis for Global Business Platforms
Digital Financial Global Stock Market Data with World Map Overlay
Futuristic Stock Market Data with Digital Connections
Digital Stock Market Financial Statistics Display
Dynamic Stock Market Display with Financial Data Trends
Dynamic Stock Market Tickers with Fluctuating Graphs
Digital Financial Data Screen Displaying Stock Information
Premium
Displaying widescreen finance board showing market trends in trading office with tickers and charts. Technology, analytics, investment, visualization, business, digital, enterprise
Dynamic Stock Market Data Display with Charts and Graphs
Dynamic Financial Data and Urban Cityscape
Stock Market Decline Represented by Red Arrow and Ticker Data