
- Home >
- Stock Photos >
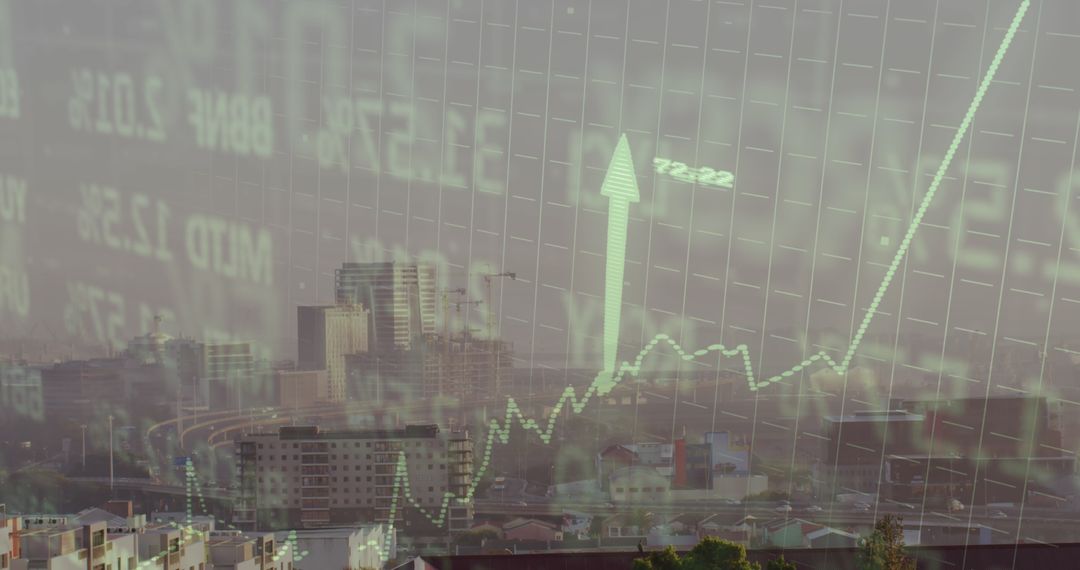
- Digital Stock Market Display with Rising Graph and Arrows
Digital Stock Market Display with Rising Graph and Arrows Image

This image depicts a digital display of stock market data, featuring financial metrics, a rising graph, and arrows indicating upward trends. It symbolizes global business, economic growth, and investment trends. Suitable for use in financial articles, business presentations, and any content related to financial markets or digital economy.
Powered by 


2
downloads
downloads
Tags:
More
Credit Photo
If you would like to credit the Photo, here are some ways you can do so
Text Link
photo Link
<span class="text-link">
<span>
<a target="_blank" href=https://pikwizard.com/photo/digital-stock-market-display-with-rising-graph-and-arrows/bdde079e130cf6e2fa08c865ba8a8b08/>PikWizard</a>
</span>
</span>
<span class="image-link">
<span
style="margin: 0 0 20px 0; display: inline-block; vertical-align: middle; width: 100%;"
>
<a
target="_blank"
href="https://pikwizard.com/photo/digital-stock-market-display-with-rising-graph-and-arrows/bdde079e130cf6e2fa08c865ba8a8b08/"
style="text-decoration: none; font-size: 10px; margin: 0;"
>
<img src="https://pikwizard.com/pw/medium/bdde079e130cf6e2fa08c865ba8a8b08.jpg" style="margin: 0; width: 100%;" alt="" />
<p style="font-size: 12px; margin: 0;">PikWizard</p>
</a>
</span>
</span>
Free (free of charge)
Free for personal and commercial use.
Author: People Creations
Similar Free Stock Images

Premium


Premium


Premium


Premium


Premium


Premium


Premium


Premium


Premium


Premium


Premium


Premium


Premium


Premium


Premium


Premium


Premium


Premium


Premium


Premium


Premium


Premium


Premium


Premium

