
- Home >
- Stock Photos >
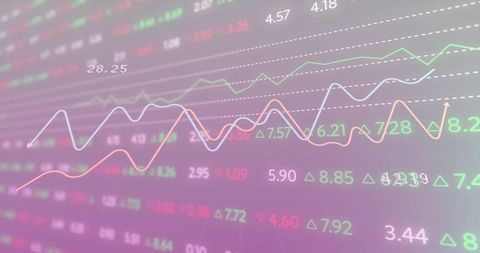
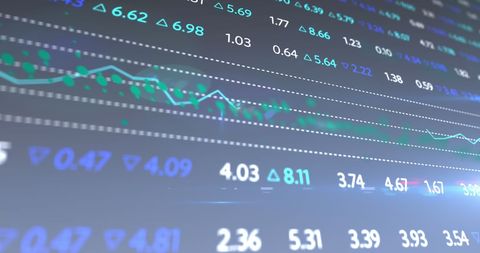
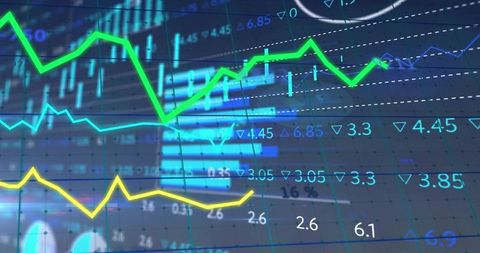
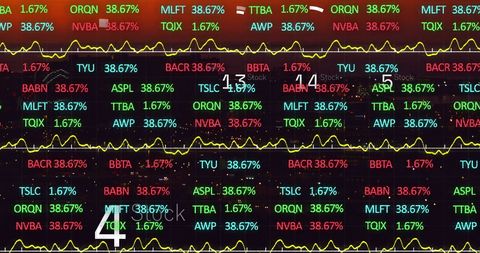
- Digital Stock Market Financial Data Visualization
Digital Stock Market Financial Data Visualization Image

Digital display of fluctuating stock prices and indicators on a virtual screen. Useful for illustrating concepts in finance, economics, and data analysis. Ideal for financial industry presentations and digital marketing content focused on investment or economics.
Powered by 


downloads
Tags:
More
Credit Photo
If you would like to credit the Photo, here are some ways you can do so
Text Link
photo Link
<span class="text-link">
<span>
<a target="_blank" href=https://pikwizard.com/photo/digital-stock-market-financial-data-visualization/47a31df9de1ba2b503aa8cee1cd8aad8/>PikWizard</a>
</span>
</span>
<span class="image-link">
<span
style="margin: 0 0 20px 0; display: inline-block; vertical-align: middle; width: 100%;"
>
<a
target="_blank"
href="https://pikwizard.com/photo/digital-stock-market-financial-data-visualization/47a31df9de1ba2b503aa8cee1cd8aad8/"
style="text-decoration: none; font-size: 10px; margin: 0;"
>
<img src="https://pikwizard.com/pw/medium/47a31df9de1ba2b503aa8cee1cd8aad8.jpg" style="margin: 0; width: 100%;" alt="" />
<p style="font-size: 12px; margin: 0;">PikWizard</p>
</a>
</span>
</span>
Free (free of charge)
Free for personal and commercial use.
Author: Authentic Images
Similar Free Stock Images

Premium


Premium

Premium


Premium

Premium


Premium

Premium


Premium


Premium

Premium

Premium

Premium


Premium

Premium


Premium


Premium

Premium


Premium


Premium

Premium


Premium


Premium


Premium


Premium

AI


Premium


Explore More Free Stock Images