- Home >
- Stock Photos >
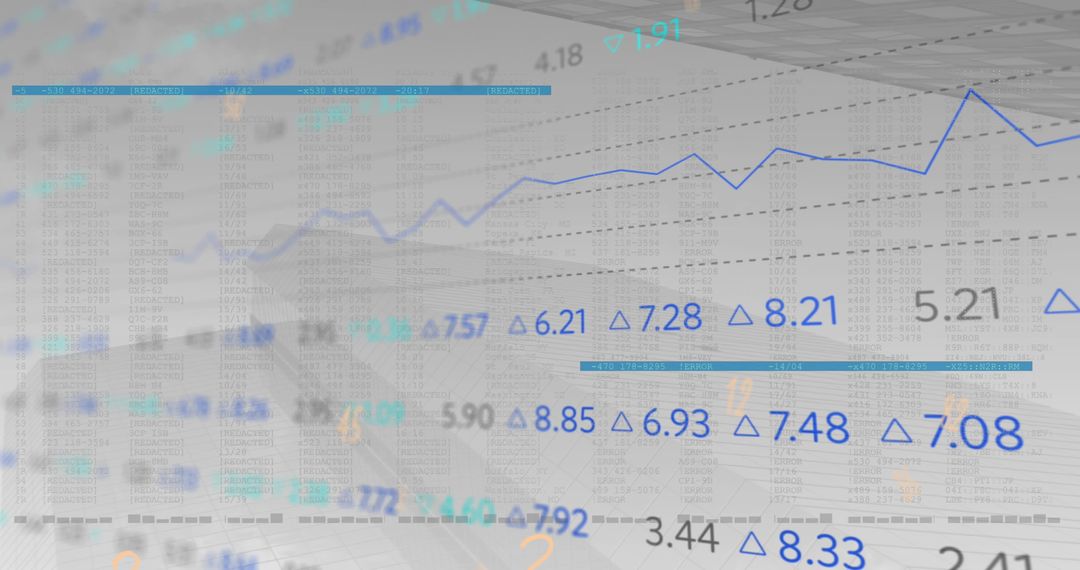
- Digital Stock Market Graph with Data in Blue
Digital Stock Market Graph with Data in Blue Image

Digital patterns and graphs representing stock market data chart focus on economic analysis and trends. Useful for illustrating global finance concepts and economics, ideal for use in business reports, articles about market analysis, fintech blogs, and educational presentations on financial topics.
Powered by  - Get 15% off with code: PIKWIZARD15


2
downloads
downloads
Tags:
More
Credit Photo
If you would like to credit the Photo, here are some ways you can do so
Text Link
photo Link
<span class="text-link">
<span>
<a target="_blank" href=https://pikwizard.com/photo/digital-stock-market-graph-with-data-in-blue/15340ec520fdb4bde547933a8f9703ff/>PikWizard</a>
</span>
</span>
<span class="image-link">
<span
style="margin: 0 0 20px 0; display: inline-block; vertical-align: middle; width: 100%;"
>
<a
target="_blank"
href="https://pikwizard.com/photo/digital-stock-market-graph-with-data-in-blue/15340ec520fdb4bde547933a8f9703ff/"
style="text-decoration: none; font-size: 10px; margin: 0;"
>
<img src="https://pikwizard.com/pw/medium/15340ec520fdb4bde547933a8f9703ff.jpg" style="margin: 0; width: 100%;" alt="" />
<p style="font-size: 12px; margin: 0;">PikWizard</p>
</a>
</span>
</span>
Free (free of charge)
Free for personal and commercial use.
Author: People Creations
Similar Free Stock Images

Premium


Premium


Premium


Premium


Premium


Premium


Premium


Premium


Premium


Premium


Premium


Premium


Premium


Premium


Premium


Premium


Premium


Premium


Premium


Premium


Premium


Premium


Premium


Premium