
- Home >
- Stock Photos >
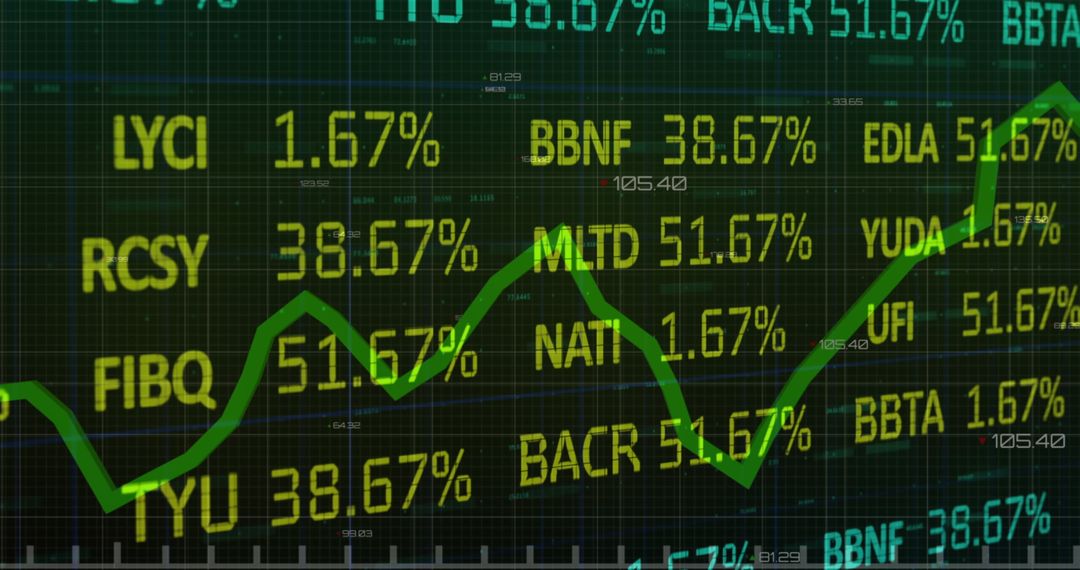
- Digital Stock Market Interface Displaying Fluctuating Percentages
Digital Stock Market Interface Displaying Fluctuating Percentages Image

Ideal for illustrating articles or presentations related to finance, trading, and economy. Useful for financial market analysis and investment strategies content. Highlights concepts like data analytics and technological advancements in financial services.
Powered by  - Get 15% off with code: PIKWIZARD15


2
downloads
downloads
Tags:
More
Credit Photo
If you would like to credit the Photo, here are some ways you can do so
Text Link
photo Link
<span class="text-link">
<span>
<a target="_blank" href=https://pikwizard.com/photo/digital-stock-market-interface-displaying-fluctuating-percentages/ef02fc55a4dd2c092ae244ab4f5e11df/>PikWizard</a>
</span>
</span>
<span class="image-link">
<span
style="margin: 0 0 20px 0; display: inline-block; vertical-align: middle; width: 100%;"
>
<a
target="_blank"
href="https://pikwizard.com/photo/digital-stock-market-interface-displaying-fluctuating-percentages/ef02fc55a4dd2c092ae244ab4f5e11df/"
style="text-decoration: none; font-size: 10px; margin: 0;"
>
<img src="https://pikwizard.com/pw/medium/ef02fc55a4dd2c092ae244ab4f5e11df.jpg" style="margin: 0; width: 100%;" alt="" />
<p style="font-size: 12px; margin: 0;">PikWizard</p>
</a>
</span>
</span>
Free (free of charge)
Free for personal and commercial use.
Author: Awesome Content
Similar Free Stock Images

Premium


Premium


Premium


Premium


Premium


Premium


Premium


Premium


Premium


Premium


Premium


Premium


Premium


Premium


Premium


Premium


Premium


Premium


Premium


Premium


Premium


Premium


Premium


Premium

