- Home >
- Stock Photos >
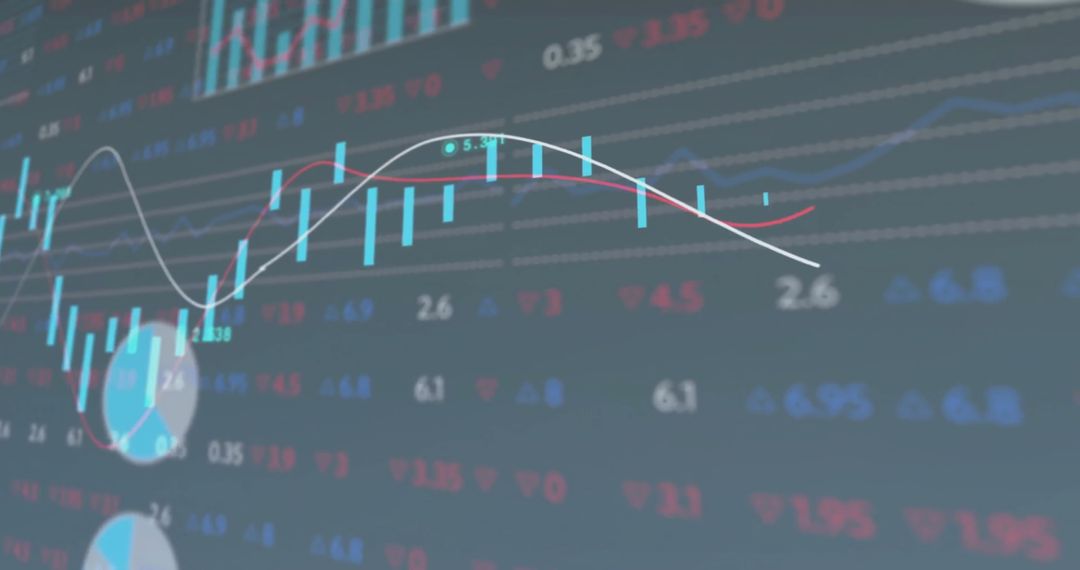
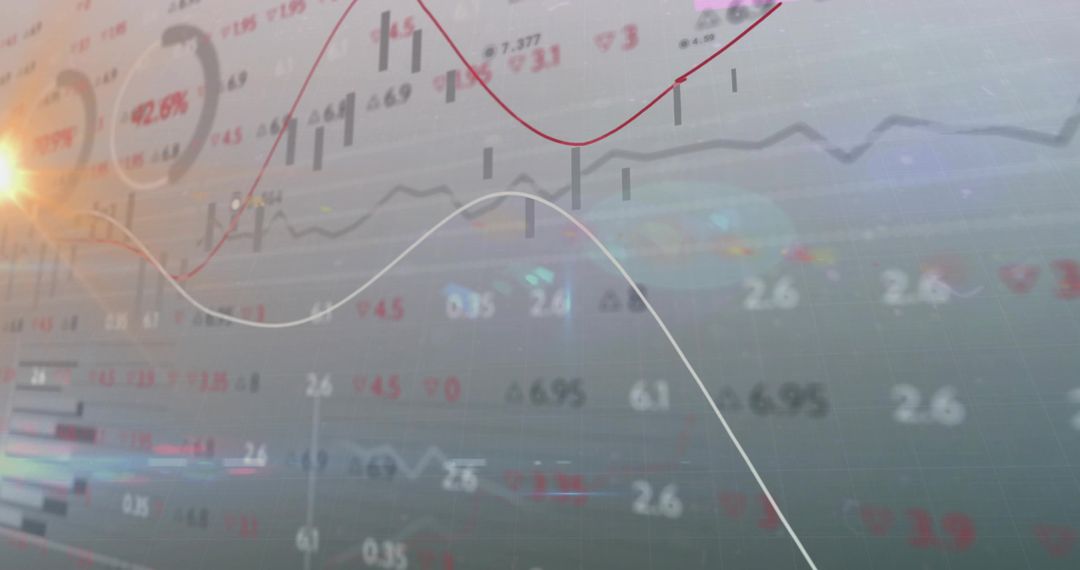
- Digital Stock Market Interface with data Graphs and Chart
Digital Stock Market Interface with data Graphs and Chart Image

Display showcasing digital representation of stock market activities. Ideal for use in presentations, articles, or educational content about finance, stock trading, data analysis, or technology applications in the modern business world.
Powered by 


2
downloads
downloads
Tags:
More
Credit Photo
If you would like to credit the Photo, here are some ways you can do so
Text Link
photo Link
<span class="text-link">
<span>
<a target="_blank" href=https://pikwizard.com/photo/digital-stock-market-interface-with-data-graphs-and-chart/92313ed0d81903bb812122b259b8f9f3/>PikWizard</a>
</span>
</span>
<span class="image-link">
<span
style="margin: 0 0 20px 0; display: inline-block; vertical-align: middle; width: 100%;"
>
<a
target="_blank"
href="https://pikwizard.com/photo/digital-stock-market-interface-with-data-graphs-and-chart/92313ed0d81903bb812122b259b8f9f3/"
style="text-decoration: none; font-size: 10px; margin: 0;"
>
<img src="https://pikwizard.com/pw/medium/92313ed0d81903bb812122b259b8f9f3.jpg" style="margin: 0; width: 100%;" alt="" />
<p style="font-size: 12px; margin: 0;">PikWizard</p>
</a>
</span>
</span>
Free (free of charge)
Free for personal and commercial use.
Author: Authentic Images
Similar Free Stock Images

Premium


Premium


Premium


Premium


Premium


Premium


Premium


Premium


Premium


Premium


Premium


Premium


Premium


Premium


Premium


Premium


Premium


Premium


Premium


Premium


Premium


Premium


Premium


Premium