- Home >
- Stock Photos >
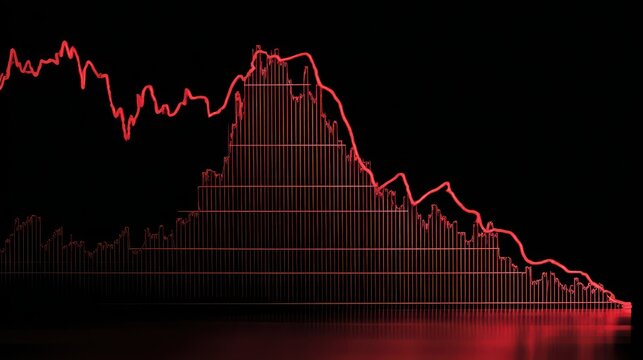
- Digital Stock Market Overview with Graphs and Numbers for Financial Analysis
Digital Stock Market Overview with Graphs and Numbers for Financial Analysis Image

This depicts abstract concepts of financial dynamics through digital representation. It can be used for finance articles, blogs, and brochures focused on market trends, analysis, investments, and economic studies. It serves as an illustrative backdrop for financial presentations or workshops regarding stock market education.
Powered by 


2
downloads
downloads
Tags:
More
Credit Photo
If you would like to credit the Photo, here are some ways you can do so
Text Link
photo Link
<span class="text-link">
<span>
<a target="_blank" href=https://pikwizard.com/photo/digital-stock-market-overview-with-graphs-and-numbers-for-financial-analysis/28ed629868468ef3fe42ca9d83b6bf21/>PikWizard</a>
</span>
</span>
<span class="image-link">
<span
style="margin: 0 0 20px 0; display: inline-block; vertical-align: middle; width: 100%;"
>
<a
target="_blank"
href="https://pikwizard.com/photo/digital-stock-market-overview-with-graphs-and-numbers-for-financial-analysis/28ed629868468ef3fe42ca9d83b6bf21/"
style="text-decoration: none; font-size: 10px; margin: 0;"
>
<img src="https://pikwizard.com/pw/medium/28ed629868468ef3fe42ca9d83b6bf21.jpg" style="margin: 0; width: 100%;" alt="" />
<p style="font-size: 12px; margin: 0;">PikWizard</p>
</a>
</span>
</span>
Free (free of charge)
Free for personal and commercial use.
Author: Awesome Content
Similar Free Stock Images

Premium


Premium


Premium


Premium


Premium


Premium


Premium


Premium


Premium


Premium


Premium


Premium


Premium


Premium


Premium


Premium


Premium


Premium


Premium


Premium


Premium


Premium


Premium


Premium