
- Home >
- Stock Photos >
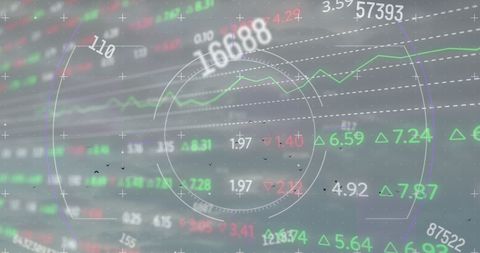
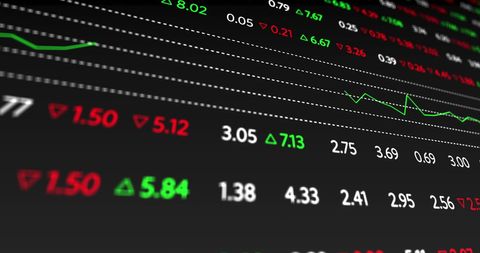
- Digital Stock Market Simulation with Data Presentation
Digital Stock Market Simulation with Data Presentation Image

Digital stock market data visualization against a black background, featuring fluctuating numbers in red and green. Suitable for articles on financial market trends, online trading, or technological advancements in finance sectors. Can be utilized for business presentations requiring high-tech, dynamic backgrounds.
Powered by  - Get 15% off with code: PIKWIZARD15


downloads
Tags:
More
Credit Photo
If you would like to credit the Photo, here are some ways you can do so
Text Link
photo Link
<span class="text-link">
<span>
<a target="_blank" href=https://pikwizard.com/photo/digital-stock-market-simulation-with-data-presentation/b9079effb889f913ff850897b1975da8/>PikWizard</a>
</span>
</span>
<span class="image-link">
<span
style="margin: 0 0 20px 0; display: inline-block; vertical-align: middle; width: 100%;"
>
<a
target="_blank"
href="https://pikwizard.com/photo/digital-stock-market-simulation-with-data-presentation/b9079effb889f913ff850897b1975da8/"
style="text-decoration: none; font-size: 10px; margin: 0;"
>
<img src="https://pikwizard.com/pw/medium/b9079effb889f913ff850897b1975da8.jpg" style="margin: 0; width: 100%;" alt="" />
<p style="font-size: 12px; margin: 0;">PikWizard</p>
</a>
</span>
</span>
Free (free of charge)
Free for personal and commercial use.
Author: People Creations
Similar Free Stock Images

Premium


Premium


Premium


Premium


Premium


Premium


Premium


Premium


Premium


Premium


Premium


Premium


Premium


Premium


Premium


Premium


Premium


Premium

Premium


Premium


Premium


Premium


Premium


Premium


Premium

Explore More Free Stock Images