- Home >
- Stock Photos >
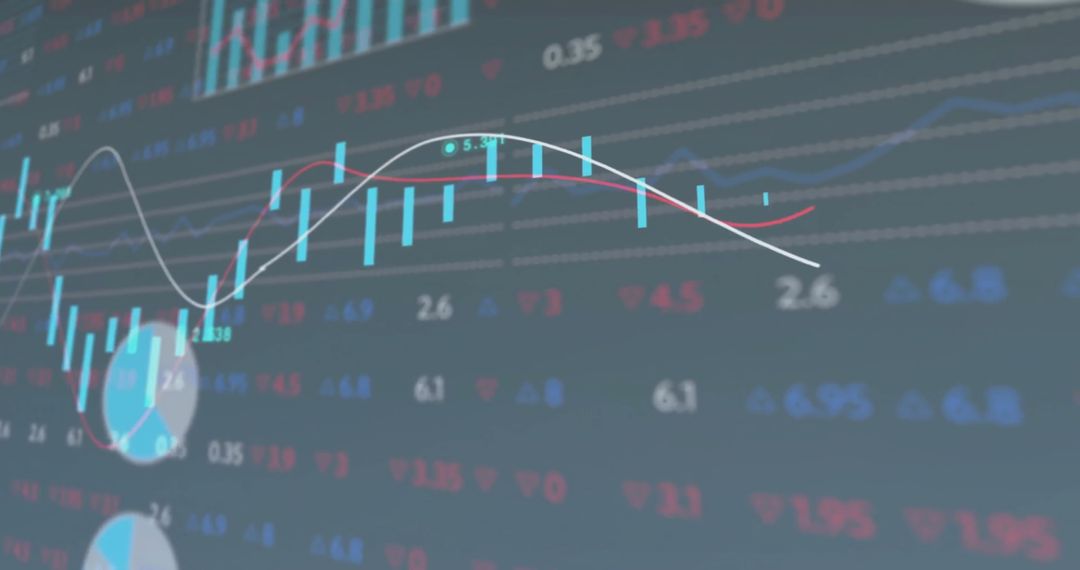
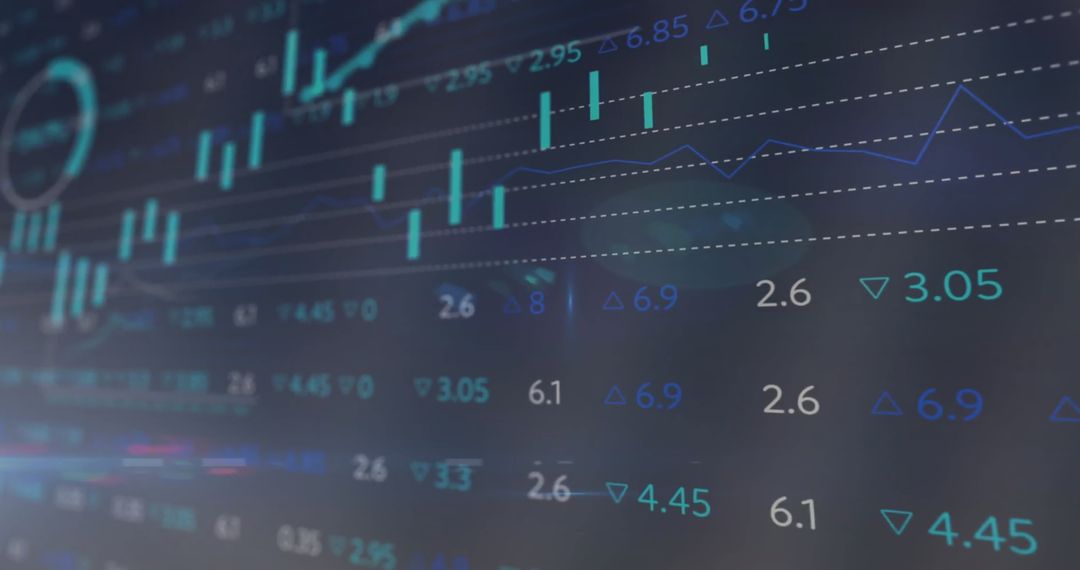
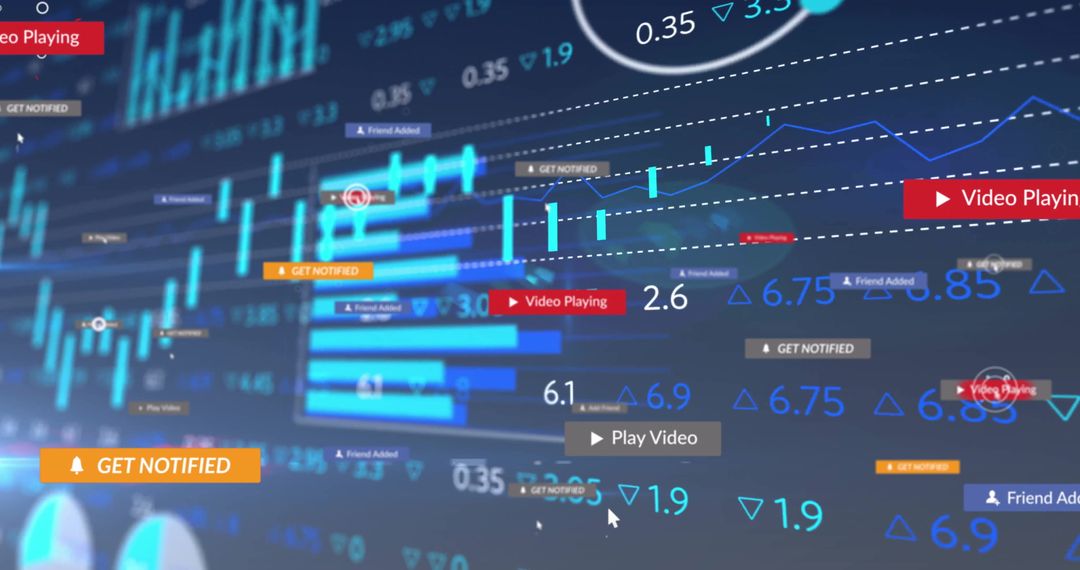
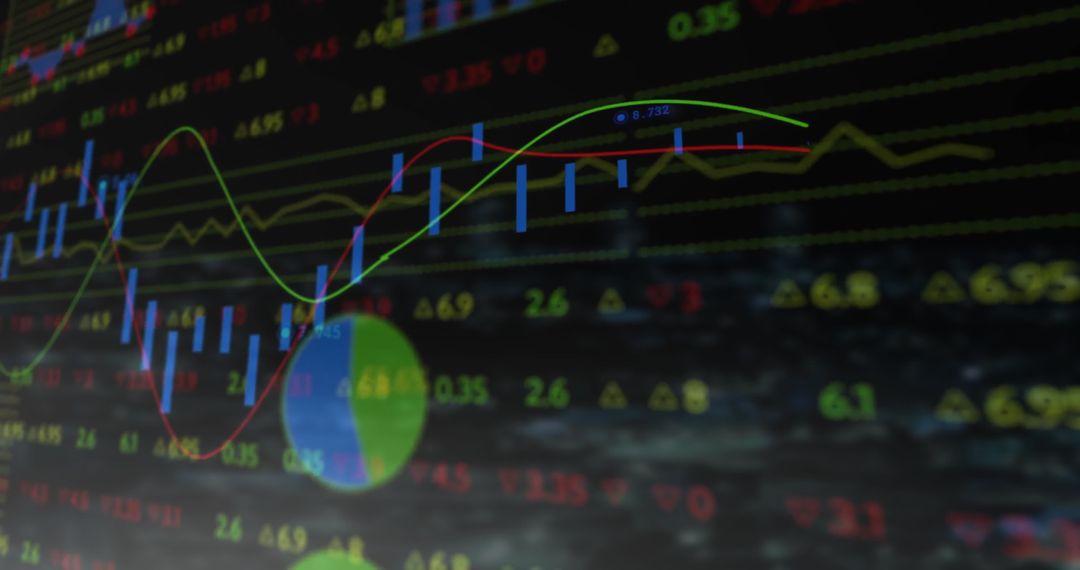
- Digital Stock Market Trading Display with Graphs and Data
Digital Stock Market Trading Display with Graphs and Data Image

Dynamic representation of a digital trading dashboard displaying various financial elements like candlestick charts, bar and line graphs, and numeric indicators. Useful for illustrating articles on stock market analysis, investment strategies, or financial technology advancements. This content could also serve educational purposes for financial labs or workshops.
Powered by 


0
downloads
downloads
Tags:
More
Credit Photo
If you would like to credit the Photo, here are some ways you can do so
Text Link
photo Link
<span class="text-link">
<span>
<a target="_blank" href=https://pikwizard.com/photo/digital-stock-market-trading-display-with-graphs-and-data/783b61aa1e8256d7cea95ec74effedcf/>PikWizard</a>
</span>
</span>
<span class="image-link">
<span
style="margin: 0 0 20px 0; display: inline-block; vertical-align: middle; width: 100%;"
>
<a
target="_blank"
href="https://pikwizard.com/photo/digital-stock-market-trading-display-with-graphs-and-data/783b61aa1e8256d7cea95ec74effedcf/"
style="text-decoration: none; font-size: 10px; margin: 0;"
>
<img src="https://pikwizard.com/pw/medium/783b61aa1e8256d7cea95ec74effedcf.jpg" style="margin: 0; width: 100%;" alt="" />
<p style="font-size: 12px; margin: 0;">PikWizard</p>
</a>
</span>
</span>
Free (free of charge)
Free for personal and commercial use.
Author: Awesome Content
Similar Free Stock Images

Premium


Premium


Premium


Premium


Premium


Premium


Premium


Premium


Premium


Premium


Premium


Premium


Premium


Premium


Premium


Premium


Premium


Premium


Premium


Premium


Premium


Premium


Premium


Premium