
- Home >
- Stock Photos >
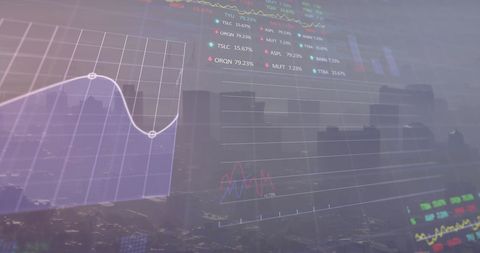
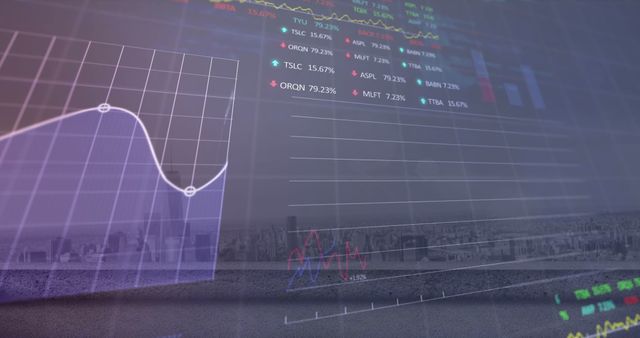
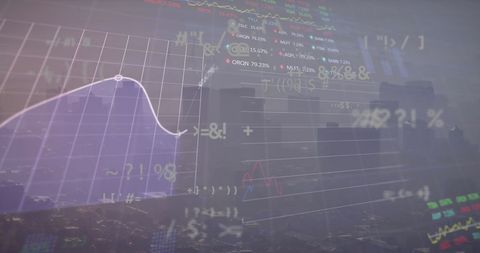
- Digital Stock Market Trends Overlaid on Abstract Background
Digital Stock Market Trends Overlaid on Abstract Background Image

This depiction presents a blend of digital stock market data overlaying an abstract, smoky background. Emphasizing concepts of global business communication and finance, the symbols and numerical details illustrate technology's intersection with economic analysis. Ideal for marketing materials or presentations about financial analytics, investment guidance, and forecasting in modern economic discussions.
Powered by  - Get 15% off with code: PIKWIZARD15


2
downloads
downloads
Tags:
More
Credit Photo
If you would like to credit the Photo, here are some ways you can do so
Text Link
photo Link
<span class="text-link">
<span>
<a target="_blank" href=https://pikwizard.com/photo/digital-stock-market-trends-overlaid-on-abstract-background/d5d24a51ff1d61237318602c976e4fda/>PikWizard</a>
</span>
</span>
<span class="image-link">
<span
style="margin: 0 0 20px 0; display: inline-block; vertical-align: middle; width: 100%;"
>
<a
target="_blank"
href="https://pikwizard.com/photo/digital-stock-market-trends-overlaid-on-abstract-background/d5d24a51ff1d61237318602c976e4fda/"
style="text-decoration: none; font-size: 10px; margin: 0;"
>
<img src="https://pikwizard.com/pw/medium/d5d24a51ff1d61237318602c976e4fda.jpg" style="margin: 0; width: 100%;" alt="" />
<p style="font-size: 12px; margin: 0;">PikWizard</p>
</a>
</span>
</span>
Free (free of charge)
Free for personal and commercial use.
Author: People Creations
Similar Free Stock Images
Loading...

Premium


Premium


Premium

Premium

Premium


Premium


Premium


Premium


Premium


Premium


Premium

Premium


Premium

Premium


Premium


Premium

Premium

Premium

Premium


Premium


Premium


Premium

Premium


Premium


Premium
