- Home >
- Stock Photos >
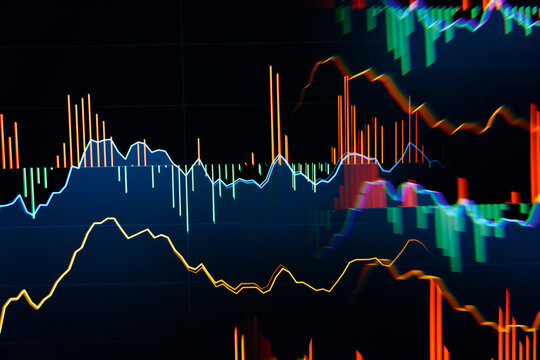
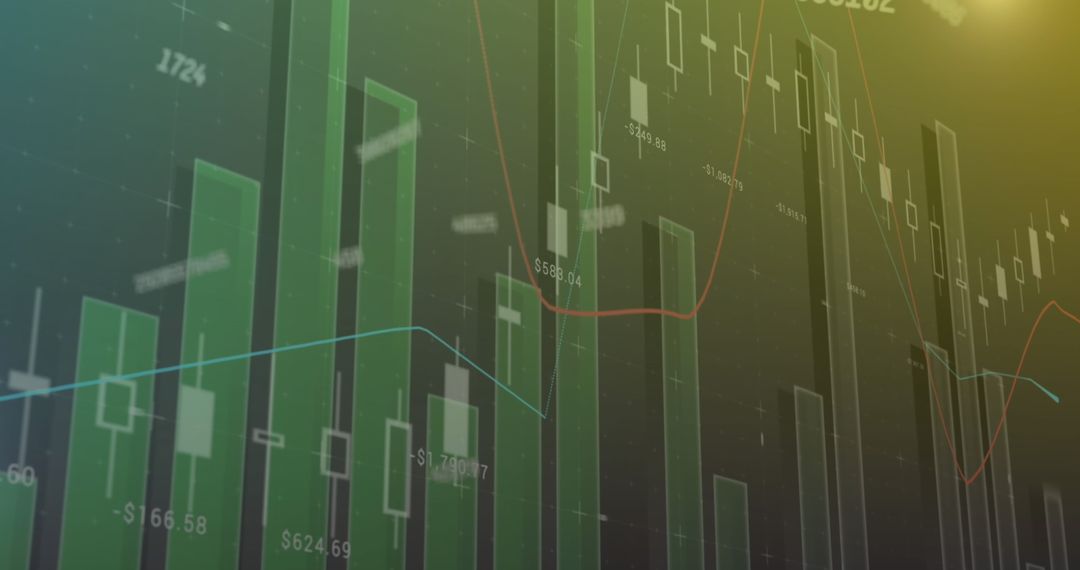
- Digital Stock Market Trends with Rising and Falling Bar Graphs
Digital Stock Market Trends with Rising and Falling Bar Graphs Image

Illustrates stock market dynamics with prominent green and red bar graphs representing growth and decline on a digital interface. Ideal for presentations, educational materials, and financial content, emphasizing investment analysis and market trends assessment.
Powered by 


2
downloads
downloads
Tags:
More
Credit Photo
If you would like to credit the Photo, here are some ways you can do so
Text Link
photo Link
<span class="text-link">
<span>
<a target="_blank" href=https://pikwizard.com/photo/digital-stock-market-trends-with-rising-and-falling-bar-graphs/88ce2d1a5ce2f5ab1b0a6be677f183b1/>PikWizard</a>
</span>
</span>
<span class="image-link">
<span
style="margin: 0 0 20px 0; display: inline-block; vertical-align: middle; width: 100%;"
>
<a
target="_blank"
href="https://pikwizard.com/photo/digital-stock-market-trends-with-rising-and-falling-bar-graphs/88ce2d1a5ce2f5ab1b0a6be677f183b1/"
style="text-decoration: none; font-size: 10px; margin: 0;"
>
<img src="https://pikwizard.com/pw/medium/88ce2d1a5ce2f5ab1b0a6be677f183b1.jpg" style="margin: 0; width: 100%;" alt="" />
<p style="font-size: 12px; margin: 0;">PikWizard</p>
</a>
</span>
</span>
Free (free of charge)
Free for personal and commercial use.
Author: People Creations
Similar Free Stock Images

Premium


Premium


Premium


Premium


Premium


Premium


Premium


Premium


Premium


Premium


Premium


Premium


Premium


Premium


Premium


Premium


Premium


Premium


Premium


Premium


Premium


Premium


Premium


Premium