
- Home >
- Stock Photos >
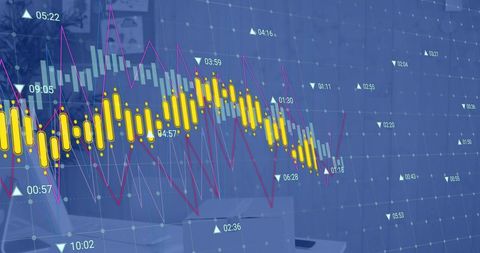
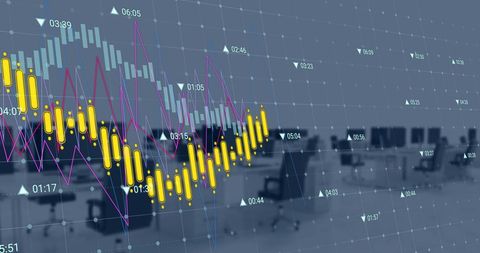
- Digital Trading Analytics with Innovative Data Visualization
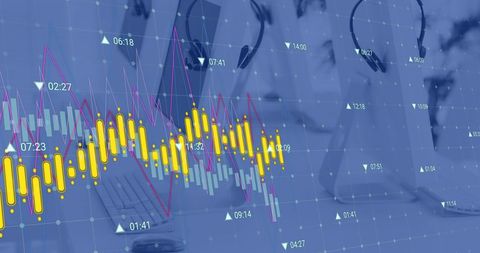
Digital Trading Analytics with Innovative Data Visualization Image

Visualization of digital trading analytics showing an upward trend of investments through yellow bars and magenta lines in a technologically advanced design. The prominent cyan arc highlights the profit percentage, symbolizing economic growth and success. Ideal for use in finance and investment presentations, technology publications, and articles discussing stocks, analytics, market trends, or financial software solutions.
Powered by 


downloads
Tags:
More
Credit Photo
If you would like to credit the Photo, here are some ways you can do so
Text Link
photo Link
<span class="text-link">
<span>
<a target="_blank" href=https://pikwizard.com/photo/digital-trading-analytics-with-innovative-data-visualization/1218bc489c9c298243220cf0f8ff1869/>PikWizard</a>
</span>
</span>
<span class="image-link">
<span
style="margin: 0 0 20px 0; display: inline-block; vertical-align: middle; width: 100%;"
>
<a
target="_blank"
href="https://pikwizard.com/photo/digital-trading-analytics-with-innovative-data-visualization/1218bc489c9c298243220cf0f8ff1869/"
style="text-decoration: none; font-size: 10px; margin: 0;"
>
<img src="https://pikwizard.com/pw/medium/1218bc489c9c298243220cf0f8ff1869.jpg" style="margin: 0; width: 100%;" alt="" />
<p style="font-size: 12px; margin: 0;">PikWizard</p>
</a>
</span>
</span>
Free (free of charge)
Free for personal and commercial use.
Author: Awesome Content
Similar Free Stock Images

Premium


Premium


Premium


Premium


Premium


Premium


Premium


Premium


Premium

Premium


Premium


Premium


Premium


Premium


Premium


Premium


Premium


Premium


Premium


Premium


Premium


Premium


Premium


Premium


Premium


Explore More Free Stock Images