1. Home > 
  2. Stock Photos > 
  3. Digital Trading and Analytics in Technology Concept

Digital Trading and Analytics in Technology Concept Image

Digital Trading and Analytics in Technology Concept

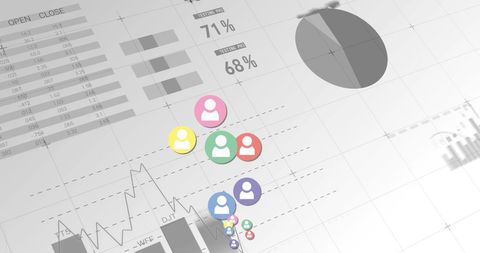
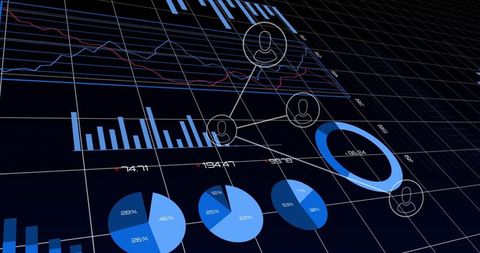
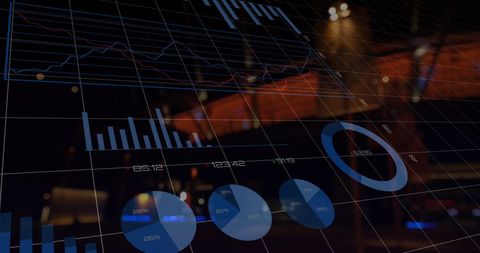
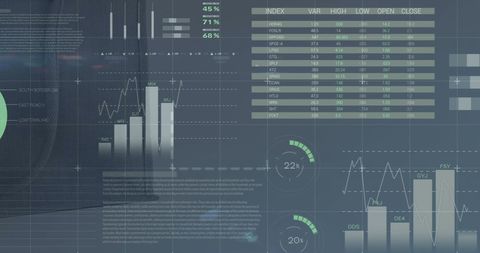
Concept of digital trading and analytics illustrated by overlaying various graphs, trading figures, and coding lines in a high-tech design structure. Used for showcasing advancements in stock market technologies, business intelligence tools, and crash course visuals for enhanced analytical processes in finance.

Powered by Shutterstock logo - Get 15% off with code: PIKWIZARD15
Glowing orange candlestick and line chart set against a dark grid background, symbolizing dynamic stock market trading, investment analytics, financial growth, trend forecasting, and technological mar - Powered by Shutterstock - Get 15% off with code: PIKWIZARD15Showing chart with candlestick bars, line graph, labels on screen, hex grid overlay, diagonal bars. Technology, finance, analytics, data, dashboard, visualization, digital - Powered by Shutterstock - Get 15% off with code: PIKWIZARD15Displaying dashboard tracking market swings on trading screen, with colored graphs and tickers. Finance, analytics, technology, investment, chart, digital, economy - Powered by Shutterstock - Get 15% off with code: PIKWIZARD15Stock Market and Trading, Stock Market Trading Graph, Investment Finance, and Business Exchange Growth Chart. - Powered by Shutterstock - Get 15% off with code: PIKWIZARD15Stock market chart with blue candlestick graph and trading data on a dark background, Stock market finance chart with business trading analytics, exchange data, and financial growth graph.	 - Powered by Shutterstock - Get 15% off with code: PIKWIZARD15

Credit Photo

If you would like to credit the Photo, here are some ways you can do so

Free (free of charge)

Free for personal and commercial use.

Author: Creative Art

Similar Free Stock Images

Digital Stock Market Data with Charts and User Icons
Premium
Modern trader engages with advanced analytics and financial charts on multiple devices, blend of technology and market insight for effective trading strategies
Digital Financial Data on Grid
Premium
A business professional examines financial data on a digital trading platform, with stock charts and indicators displayed vividly against a dark office background.
Premium
Stock Market and Trading, Stock Market Trading Graph, Investment Finance, and Business Exchange Growth Chart.
Global Data Processing Over Digital Interface Screens
Futuristic Data Processing with Graphs and Charts Overlay
Dynamic Digital Interface with Question Marks on Statistics Background
Premium
Happy stock investor or trader, financial adviser analyzing financial trading crypto market advertising digital mobile exchange app investing finances funds holding smartphone. Double exposure, banner
Digital Interface of Calculator and Code for Global Business Insights
Digital Financial Data Analytics Over Urban Cityscape
Digital Data Analytics Interface with Statistical Graphs
Futuristic Financial Data Analytics Interface with Bokeh Effect
Social Media Reactions Overlaying Data and Analytics Background
Digital Financial Data Over a Nighttime Urban Setting
Digital Network of Business Icons Over Financial Data
Eco Analytics Dashboard with Finance and Sustainability Metrics
Digital Data Processing with Mathematical Formulas and Global Map Design
Premium
African American Stock Exchange Trader Monitoring Real-Time Stocks and Exchange Market Charts on Digital Tablet and Computer with Multi-Monitor Desktop. Investment Agent Working in Office. Zoom In.
Dynamic Data Minimalistic Futuristic Technology
Digital Data Interface with Statistical Analysis and Charts
Futuristic Data Analytics Interface with Charts and Code
Global Network Connections and Data Interface Visualization
Premium
An investor monitors real-time stock market data on a smartphone and laptop, analyzing charts, financial trends, and cryptocurrency for informed trading decisions in a digital workspace.
Premium
Stock market price charts and global market graphs. Financial trading data. Foreign exchange and commodities. Trader using a laptop computer to invest in various financial products.
Premium
Investment data analysis with interactive financial dashboards and charts for performance insights, planning, and ROI tracking. Ideal for fintech platforms, economic review, and digital forecasting.
Digital Interface of Global Business Data Processing
Futuristic Financial Data Analysis with Digital Charts and Graphs
Digital Financial Data Analytics with Graphs and Charts
Media Icons Overlaying Digital Financial Data Display
Premium
Tapping man's hands with watch checking smartphone at cafe table ceramic cup shakers charts overlay. Device, finance, trading, graphs, coffeehouse, ambient, minimalist
Cybersecurity Cloud Lock Overlay on Digital Data Dashboard
Digital Data Interface with Infographics and Lights
Financial Data Interfaces and Digital Analytics Concept
Dynamic Numbers and Data Processing Concept on Black Background
Abstract Financial Data Analysis in Modern Office Environment
Digital Data Visualization with Code and Analytical Charts
Premium
Data analyzing and stock market visualization with digital charts, financial dashboards, and performance metrics. Ideal for investment analysis, trading strategy, and economic forecasting.
Businesswoman Analyzing Data on Digital Display with Headset
Global Financial Data and Mathematical Integration Concept
Premium
Professionals collaboratively analyzing financial data with declining graphs and warning signals, highlighting market trends, challenges, and strategic planning efforts. Trope
Global Data Analytics and QR Code Interface Concept
Warehouse Data Analysis in Logistics Technology Visualization
Futuristic Stock Market Analysis with Digital Icons and Graphs
Premium
Growth graph of business. Successful business, growth strategy and achieving goals with the rising arrow. Business strategy development and growing growth plan.
Digital Data Visualization Over Globe with Technology Interface
Holographic Financial Data and Code Overlays
Data Processing Overlay on Urban Landscape with Graph
Premium
Businessman trader investor broker holding tablet computer analyzing charts bank account market rate global indexes online forecast on stock exchange digital finances trade platform. Close up. Banner
Futuristic Interface with Statistical Data and Graphs
Digital Data Analytics with Financial Transaction Overlay
Social Media Icons Overlaying Financial Data Visualization
Digital Data Analysis with Virus Imagery and Security Interface
Premium
Digital financial charts overlay Manhattan skyline at night, showcasing glowing graphs, data points, and analysis. Concept of trading and investing
Abstract Data Processing for Global Stock Market Analysis
Global Network and Business Data with Spinning Globe
Global Financial Graphs Over Rotating Digital Globe
Digital Analytics Override Business Discussions in Modern Office
Premium
Businessman analyzing candlestick chart on digital tablet with green glow. Concept of trading dashboard, stock analytics, fintech UI, market prediction and crypto tools.
Digital Data Interface with Social Media User Network Incorporation
Futuristic Financial Analytics and Data with Digital Interfaces
Colored User Icons Overlaid on Analytical Business Graphs
Global Financial Data Processing over Earth's Surface
Digital Urban Statistics Visualization on Blue Background
Premium
Economic caution visual showing risk alerts and financial volatility. Warning signs highlight economic downturn, market risk, finance crisis, and uncertainty in data-driven analysis. Muxer
High-Tech Data Processing with Global Business Icons
Digital Data Analytics on Blue Background
Business Strategy Planning with Data Analysis Charts
Futuristic Digital Data Processing Over Urban Cityscape
Premium
Financial growth strategy leverages data analytics for investment optimization and market performance Parse
Global Financial Data and Graphs Overlay on Cityscape
Abstract Digital Technology with Statistics and Question Marks
Rotating Cloud Icons with Graphs in Digital Interface
Digital Networking Symbols on World Map with Data Figures
Premium
Financial technology and investment capital gain analytics with data of digital finance, stock market trends, fintech growth, and business performance using smart financial tools.
Animated Countdown with Stock Market Data Visuals
Premium
Gold bar Trading business people hand offering gold Investment in gold mining company or Trading gold on the stock exchange Rising prices
Conceptual Global Connections with Digital Interface Overlay
Virtual Data Interface with Analytics and Chat Messaging
Secure Financial Data Encryption in Digital Interface
Warehouse Operations Amid Global Financial Analysis Overlay
Premium
Online trading, Investment, Strategy market plan, and Stock mark
Global Data Processing and Analytics Interface
Bitcoin Symbol with Stock Market Data Visualization in Office
Futuristic Digital Interface with Graphs and Charts in Blue Tones
Diverse Team Analyzing Data with Futuristic Digital Graph Overlays
5G Network Technology with Digital Data Visualization
Rotating Cloud Networking Symbol with Digital Business Graphs
Abstract Financial Graphs and Charts on Digital Interface
Financial Data Charts and Graphs with Blue Tones
Premium
Investment Finance, Risk volatility management. Decision uncertainty caution. Risk assessment. Financial concept. Stock market analysis concept. Trading trading chart. Financial investment. Finance.
Digital Hologram Indicators with Financial Data Analysis Concepts
Digital Data Visualization with Blue Financial Analytics Interface
Social Media Icons on Financial Data Background
Digital Interface with Financial and Statistical Data Visualizations
Digital Interface with Media Icons Over Financial Data Analysis
Data Driven Technology Statistics and Graph Analytics
Abstract Digital World Map with Data Analytics AI Graphics
Digital Icons Floating Over Statistical Graph on White Background
Global Financial Data Visualization on Navy Background
Digital Interface with Financial Analytics and Data Processing
Futuristic Interface with Data Highlights and Analytics
Financial Technology Data Innovation with Modern Skyline
Businesswoman Analyzing Financial Data in Futuristic Office
Premium
Showing data on digital grid candlesticks and neon-green or dark-blue line graphs with annotations. Finance, analytics, technology, digital, modern, investment, market
Futuristic Blue Data Analytics Interface with Graphs and Statistics
Displaying Futuristic 3D Analytics Dashboard with Network Nodes, Donut Chart and Line Graphs
Abstract Global Financial Data and Technology Interface
Digital Display of Bitcoin Overlaid with Data Graphs
Premium
Close-up of businesswoman in glasses reflecting digital graphs, symbolizing data analysis, e-commerce analytics, strategy. Concept of business, modern technologies, finance, investment, digital market
Futuristic AI Brain with Speech Bubble and Data Visualizations
Dynamic Financial Data Visualization Over Black Background
Analyzing Social Media Trends on Digital Display Screen
Digital Dashboard Showing Energy and Sustainability Analytics
Premium
Hand interacting with a futuristic financial interface displaying charts, graphs, and percentages on a dark blue gradient background, concept of trading
Digital Interface with Charts and Graphs Analyzing Data
Advanced Digital Interface with Data Analytics Overlaid on Network
Complex Financial Analytics and Data Visualization in Digital Space
Social Media Like Icons and Statistics Interface
Business Network and Stock Market Analysis Concept
Global Digital Data Interface with Charts and Graphs
Futuristic Financial Data Interface with Digital Charts
Digital Social Media Engagement and Data Analytics Concept
Premium
A business hand drawing a glowing rising graph with digital bars and arrows, symbolizing financial growth, data analytics, success, performance improvement, and modern business strategy in a digital
Futuristic Financial Chart Overlay with Cityscape Background
Explore More Free Stock Images