
- Home >
- Stock Photos >
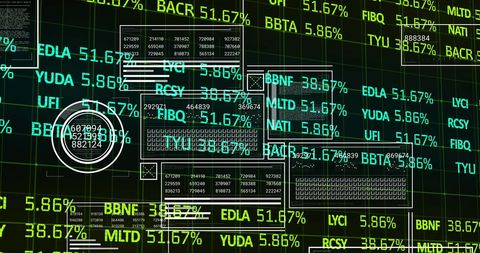
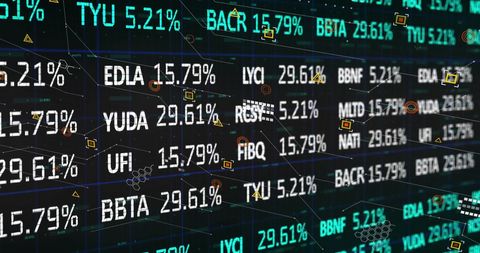
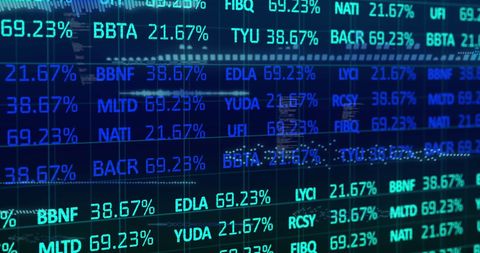
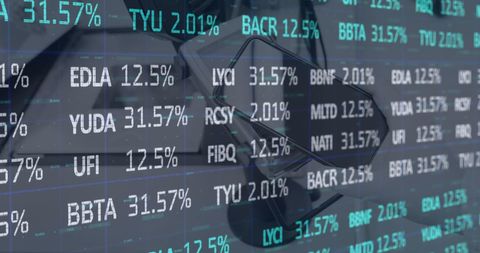
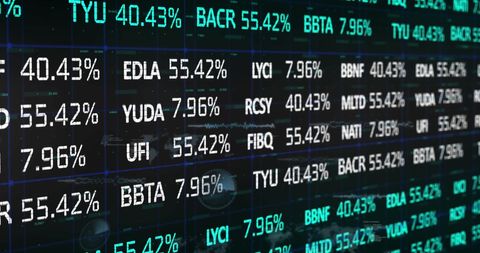
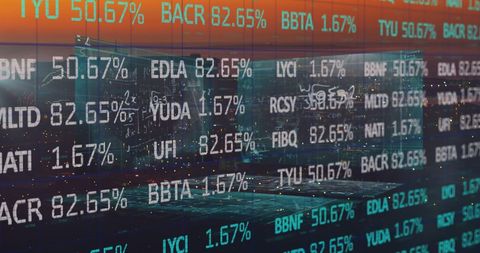
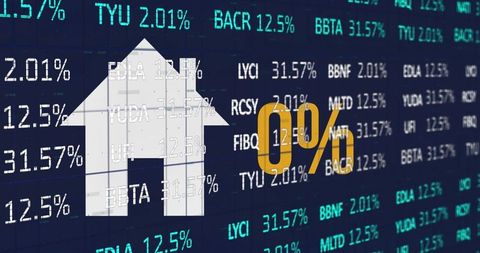
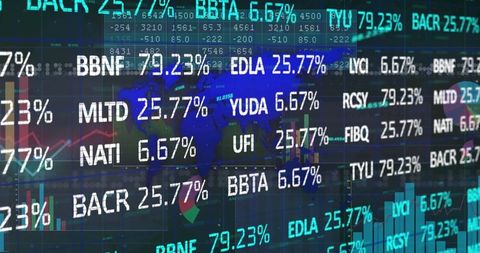
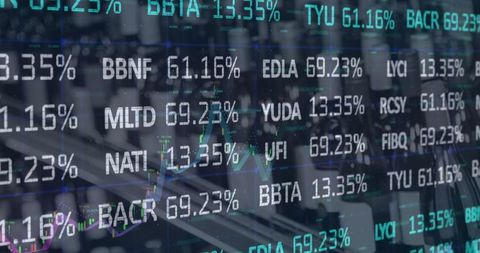
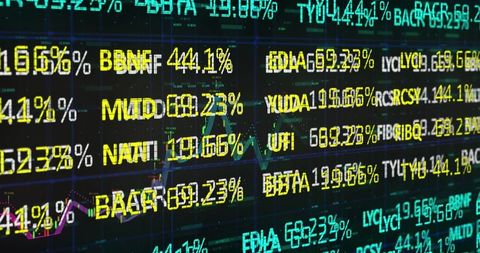
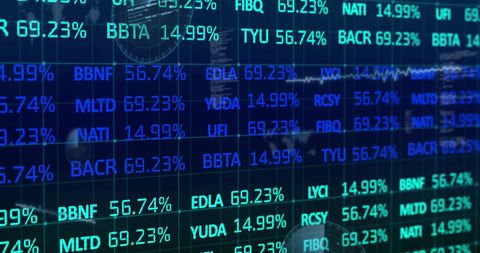
- Digital Trading Dashboard Displaying Financial Data Analysis
Digital Trading Dashboard Displaying Financial Data Analysis Image

This image portrays a digital trading dashboard filled with ticker codes and percentage movements, making it ideal for illustrating concepts related to finance, stock markets, and data analysis. Useful for websites on trading technologies, financial blogs, or presentations concerning modern financial systems and analytics.
Powered by  - Get 15% off with code: PIKWIZARD15


downloads
Tags:
More
Credit Photo
If you would like to credit the Photo, here are some ways you can do so
Text Link
photo Link
<span class="text-link">
<span>
<a target="_blank" href=https://pikwizard.com/photo/digital-trading-dashboard-displaying-financial-data-analysis/ae792c4e043ad77041179de6de2c2cb9/>PikWizard</a>
</span>
</span>
<span class="image-link">
<span
style="margin: 0 0 20px 0; display: inline-block; vertical-align: middle; width: 100%;"
>
<a
target="_blank"
href="https://pikwizard.com/photo/digital-trading-dashboard-displaying-financial-data-analysis/ae792c4e043ad77041179de6de2c2cb9/"
style="text-decoration: none; font-size: 10px; margin: 0;"
>
<img src="https://pikwizard.com/pw/medium/ae792c4e043ad77041179de6de2c2cb9.jpg" style="margin: 0; width: 100%;" alt="" />
<p style="font-size: 12px; margin: 0;">PikWizard</p>
</a>
</span>
</span>
Free (free of charge)
Free for personal and commercial use.
Author: People Creations
Similar Free Stock Images
Premium

Premium

Premium


Premium


Premium


Premium


Premium

Premium


Premium


Premium


Premium


Premium


Premium


Premium


Premium


Premium

Premium


Premium

Premium

Premium

Premium


Premium


Premium


Premium

Premium

Explore More Free Stock Images