
- Home >
- Stock Photos >
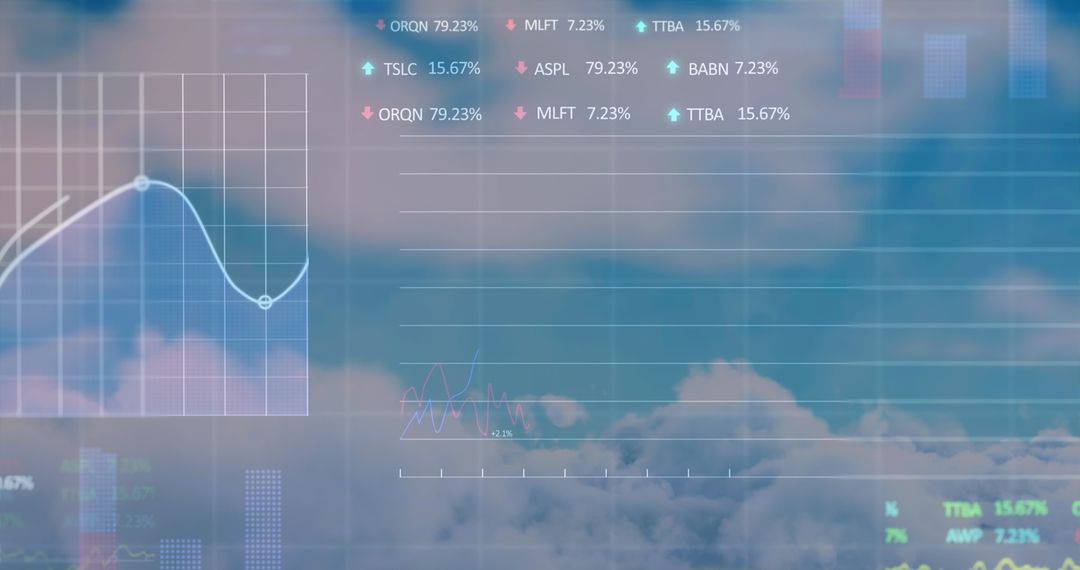
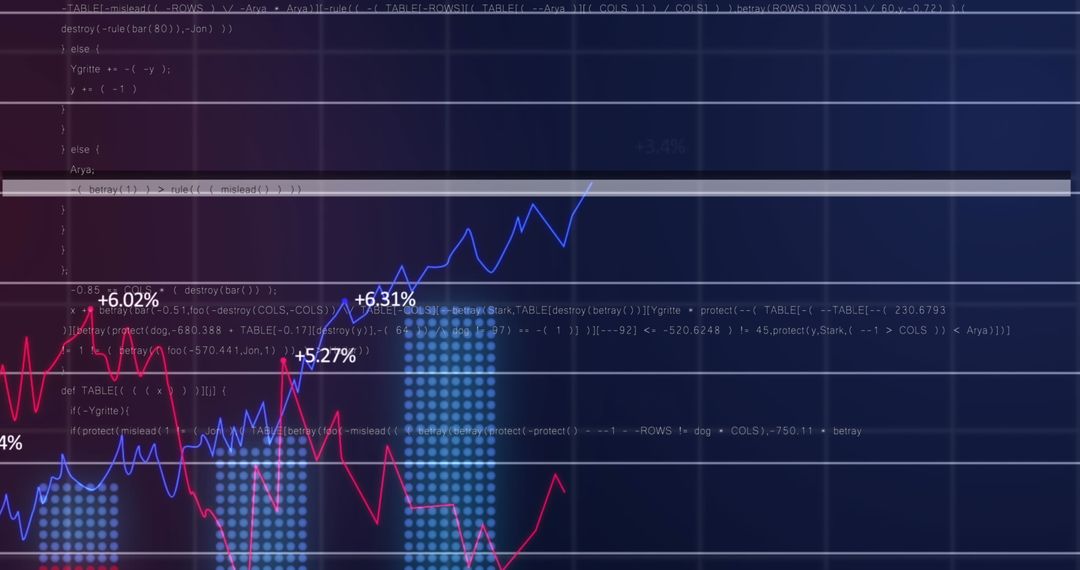
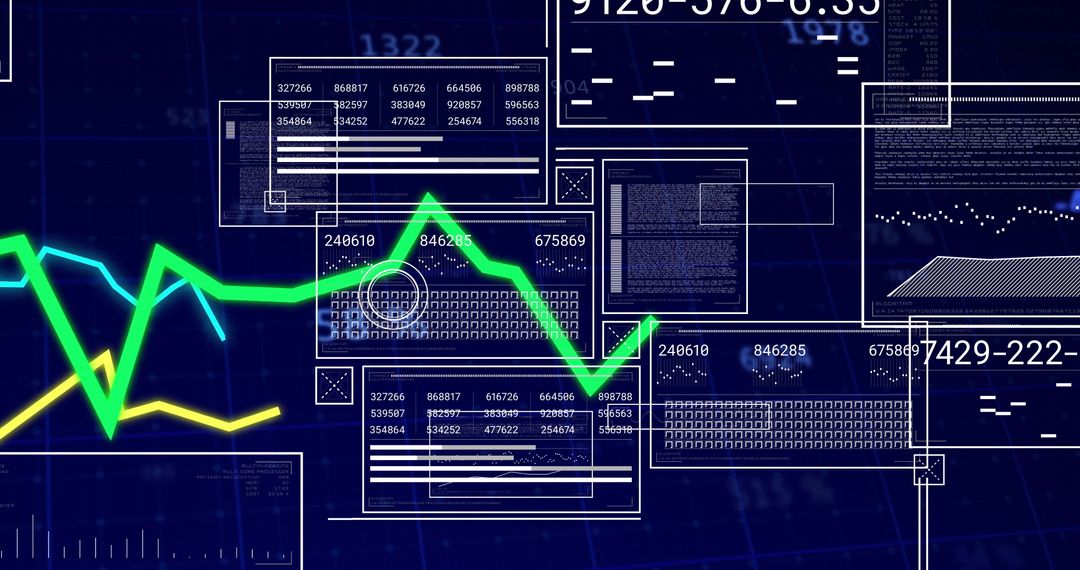
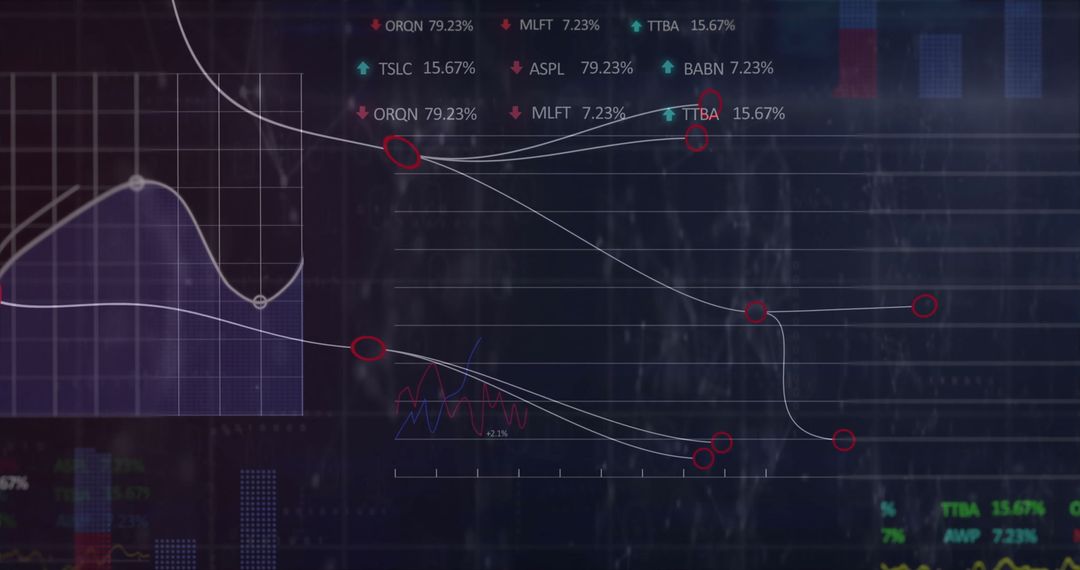
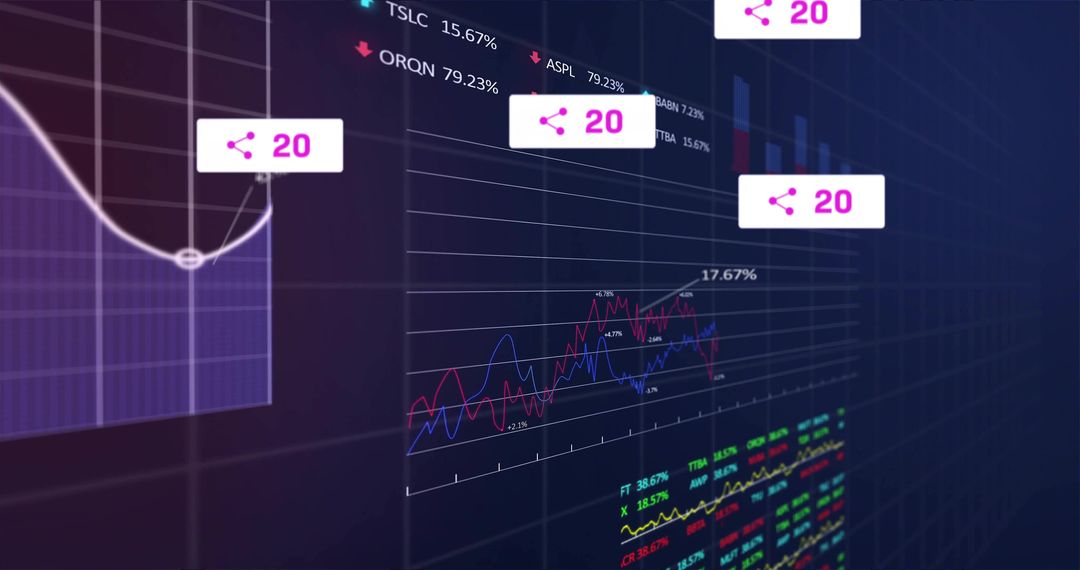
- Digital Trading Dashboard Showing Financial Data and Market Trends
Digital Trading Dashboard Showing Financial Data and Market Trends Image

Financial dashboard displaying a line graph, bar chart, and ticker table. Ideal for use in presentations or reports about stock market trends, investment analysis, or financial technology solutions, showcasing current data visualization techniques and financial analysis tools.
Powered by 


2
downloads
downloads
Tags:
More
Credit Photo
If you would like to credit the Photo, here are some ways you can do so
Text Link
photo Link
<span class="text-link">
<span>
<a target="_blank" href=https://pikwizard.com/photo/digital-trading-dashboard-showing-financial-data-and-market-trends/b5700f62b646bde6494ad940e645a396/>PikWizard</a>
</span>
</span>
<span class="image-link">
<span
style="margin: 0 0 20px 0; display: inline-block; vertical-align: middle; width: 100%;"
>
<a
target="_blank"
href="https://pikwizard.com/photo/digital-trading-dashboard-showing-financial-data-and-market-trends/b5700f62b646bde6494ad940e645a396/"
style="text-decoration: none; font-size: 10px; margin: 0;"
>
<img src="https://pikwizard.com/pw/medium/b5700f62b646bde6494ad940e645a396.jpg" style="margin: 0; width: 100%;" alt="" />
<p style="font-size: 12px; margin: 0;">PikWizard</p>
</a>
</span>
</span>
Free (free of charge)
Free for personal and commercial use.
Author: Awesome Content
Similar Free Stock Images

Premium


Premium


Premium


Premium


Premium


Premium


Premium


Premium


Premium


Premium


Premium


Premium


Premium


Premium


Premium


Premium


Premium


Premium


Premium


Premium


Premium


Premium


Premium


Premium

