- Home >
- Stock Photos >
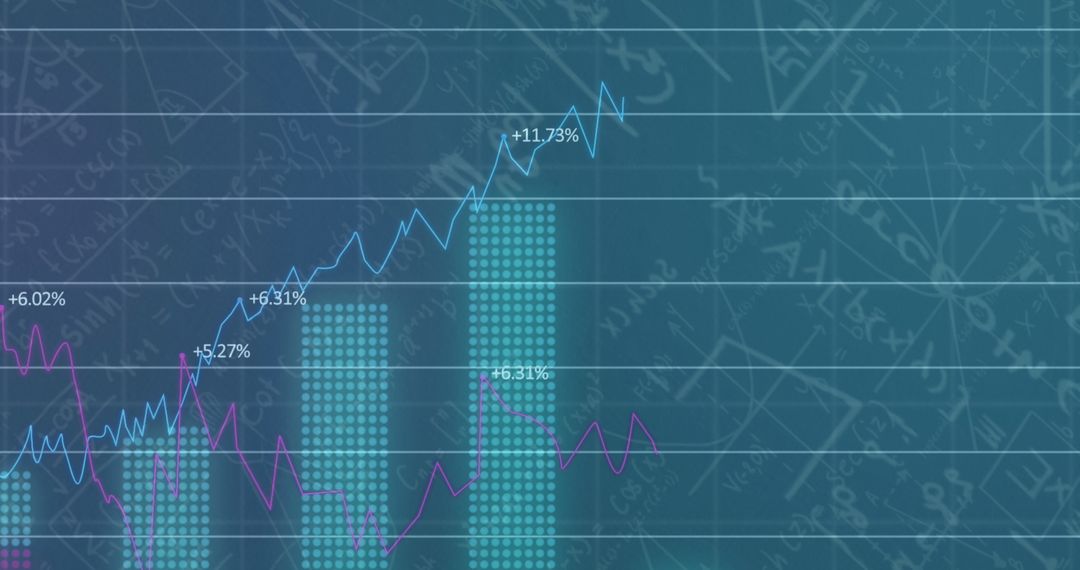
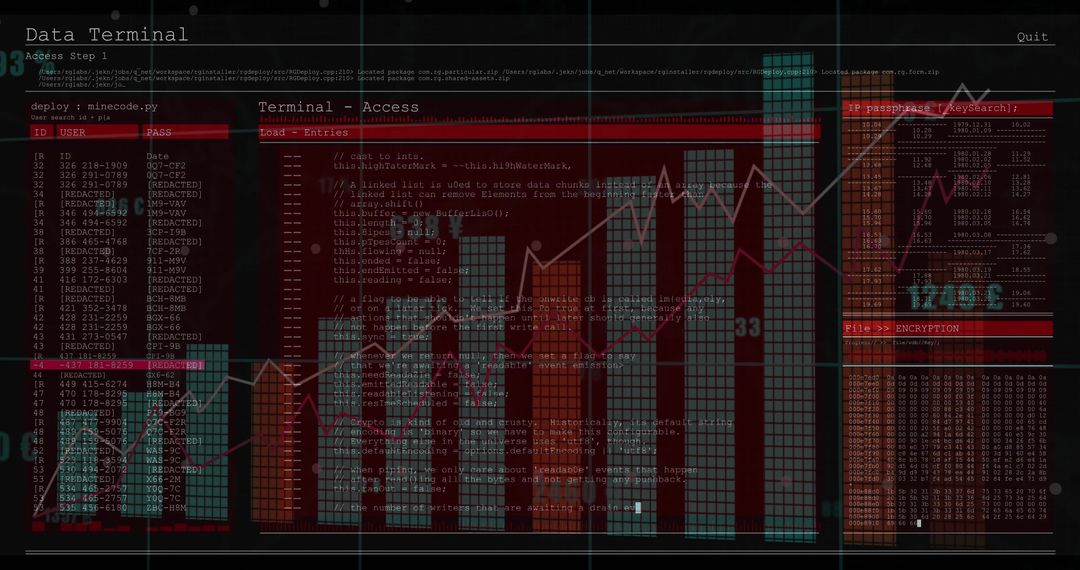
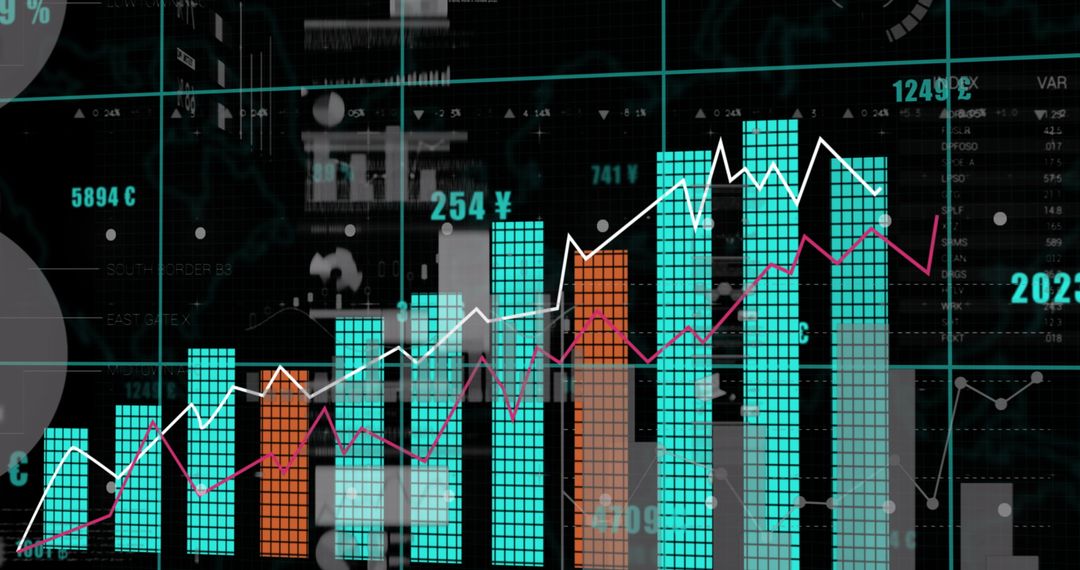
- Digital trading dashboard showing rising bar chart and trend lines for investment analysis
Digital trading dashboard showing rising bar chart and trend lines for investment analysis Image

High-contrast digital trading dashboard featuring teal and orange vertical bar graphs overlaid with white and magenta trend lines and numerical grid. Foreground showing stacked grid bars with ascending values, midground displaying line charts and markers, background presenting blurred market data and percentage figures for layered depth. Composition focusing on upward momentum and mixed short-term and long-term indicators, conveying dynamic market performance and data-driven decision making. Ideal for fintech websites, investor presentations, financial reports, blog headers, market analysis articles, trading platform UI previews, pitch decks, social media finance posts, and marketing materials for investment services. Use for illustrating market growth, performance review, portfolio analysis, economic forecast, and analytics concepts. Color palette and graphic elements supporting modern tech and corporate branding; suitable for desktop hero banners, slide backgrounds, printed brochures, and app mockups.
Powered by  - Get 15% off with code: PIKWIZARD15


0
downloads
downloads
Tags:
More
Credit Photo
If you would like to credit the Photo, here are some ways you can do so
Text Link
photo Link
<span class="text-link">
<span>
<a target="_blank" href=https://pikwizard.com/photo/digital-trading-dashboard-showing-rising-bar-chart-and-trend-lines-for-investment-analysis/37b919139d0194b6c5947b5b74e56a16/>PikWizard</a>
</span>
</span>
<span class="image-link">
<span
style="margin: 0 0 20px 0; display: inline-block; vertical-align: middle; width: 100%;"
>
<a
target="_blank"
href="https://pikwizard.com/photo/digital-trading-dashboard-showing-rising-bar-chart-and-trend-lines-for-investment-analysis/37b919139d0194b6c5947b5b74e56a16/"
style="text-decoration: none; font-size: 10px; margin: 0;"
>
<img src="https://pikwizard.com/pw/medium/37b919139d0194b6c5947b5b74e56a16.jpg" style="margin: 0; width: 100%;" alt="" />
<p style="font-size: 12px; margin: 0;">PikWizard</p>
</a>
</span>
</span>
Free (free of charge)
Free for personal and commercial use.
Author: People Creations
Similar Free Stock Images

Premium


Premium


Premium


Premium


Premium


Premium


Premium


Premium


Premium


Premium


Premium


Premium


Premium


Premium


Premium


Premium


Premium


Premium


Premium


Premium


Premium


Premium


Premium


Premium