- Home >
- Stock Photos >
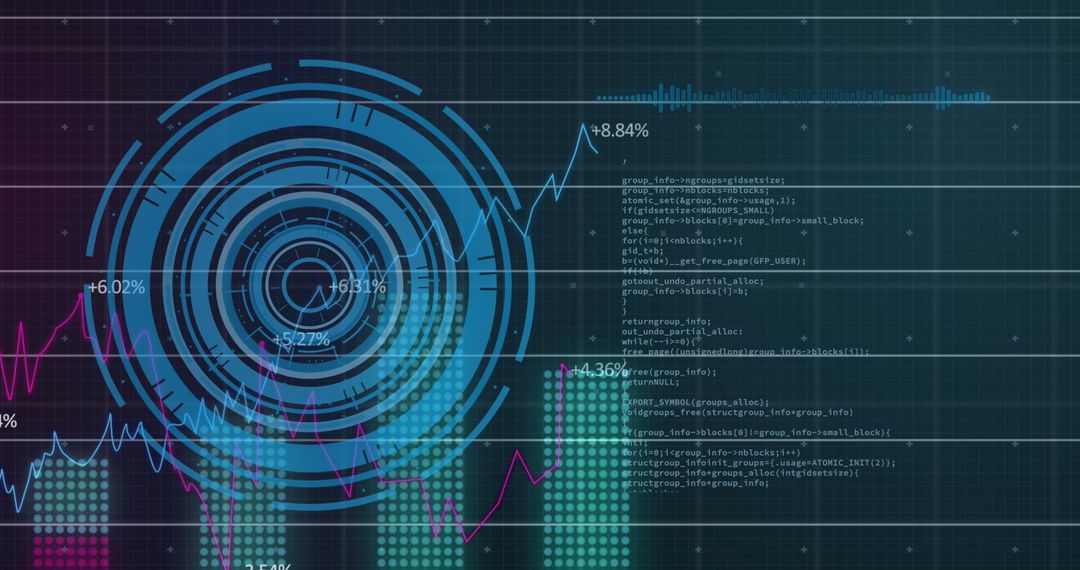
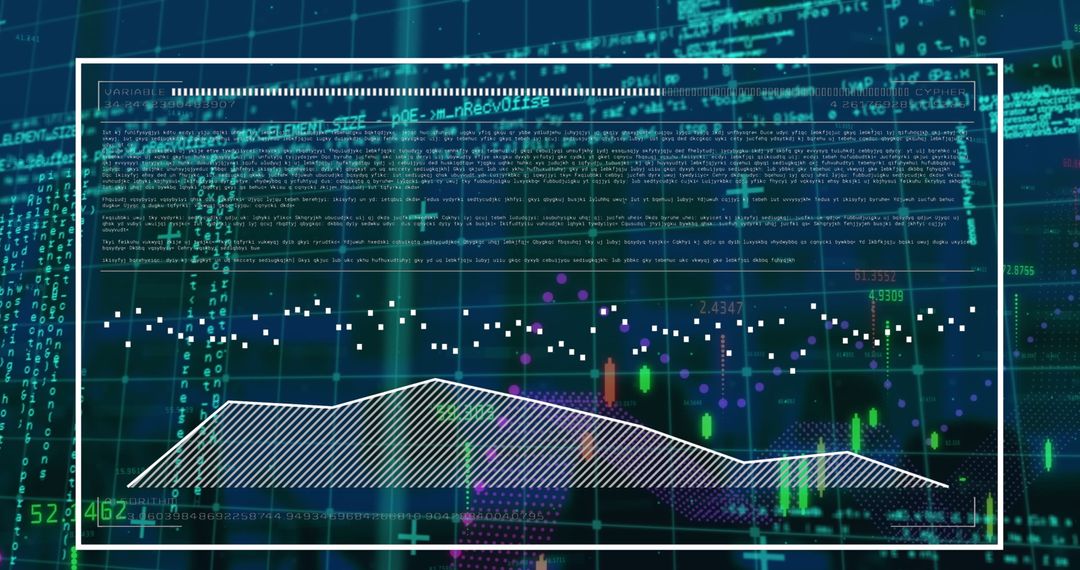
- Digital Trading Dashboard Visualizing Market Growth with Dual Line Charts and Dotted Bars
Digital Trading Dashboard Visualizing Market Growth with Dual Line Charts and Dotted Bars Image

Futuristic trading dashboard showing dual line graphs over dotted bar charts on blue-purple gradient with HUD elements and percentage labels. Ideal for illustrating market growth, performance reports, investor presentations, fintech websites, trading platform interfaces, app backgrounds, and financial marketing. Working well as hero banner, website header, social media ad, or brochure cover. Color palette and neon accents drawing attention to data points and trends while grid lines and radial compass motif suggesting global market connectivity. High-contrast abstract composition allowing text overlay and logo placement.
Powered by  - Get 15% off with code: PIKWIZARD15


0
downloads
downloads
Tags:
More
Credit Photo
If you would like to credit the Photo, here are some ways you can do so
Text Link
photo Link
<span class="text-link">
<span>
<a target="_blank" href=https://pikwizard.com/photo/digital-trading-dashboard-visualizing-market-growth-with-dual-line-charts-and-dotted-bars/5b108bf584507307c164897176975b43/>PikWizard</a>
</span>
</span>
<span class="image-link">
<span
style="margin: 0 0 20px 0; display: inline-block; vertical-align: middle; width: 100%;"
>
<a
target="_blank"
href="https://pikwizard.com/photo/digital-trading-dashboard-visualizing-market-growth-with-dual-line-charts-and-dotted-bars/5b108bf584507307c164897176975b43/"
style="text-decoration: none; font-size: 10px; margin: 0;"
>
<img src="https://pikwizard.com/pw/medium/5b108bf584507307c164897176975b43.jpg" style="margin: 0; width: 100%;" alt="" />
<p style="font-size: 12px; margin: 0;">PikWizard</p>
</a>
</span>
</span>
Free (free of charge)
Free for personal and commercial use.
Author: Awesome Content
Similar Free Stock Images

Premium


Premium


Premium


Premium


Premium


Premium


Premium


Premium


Premium


Premium


Premium


Premium


Premium


Premium


Premium


Premium


Premium


Premium


Premium


Premium


Premium


Premium


Premium


Premium