- Home >
- Stock Photos >
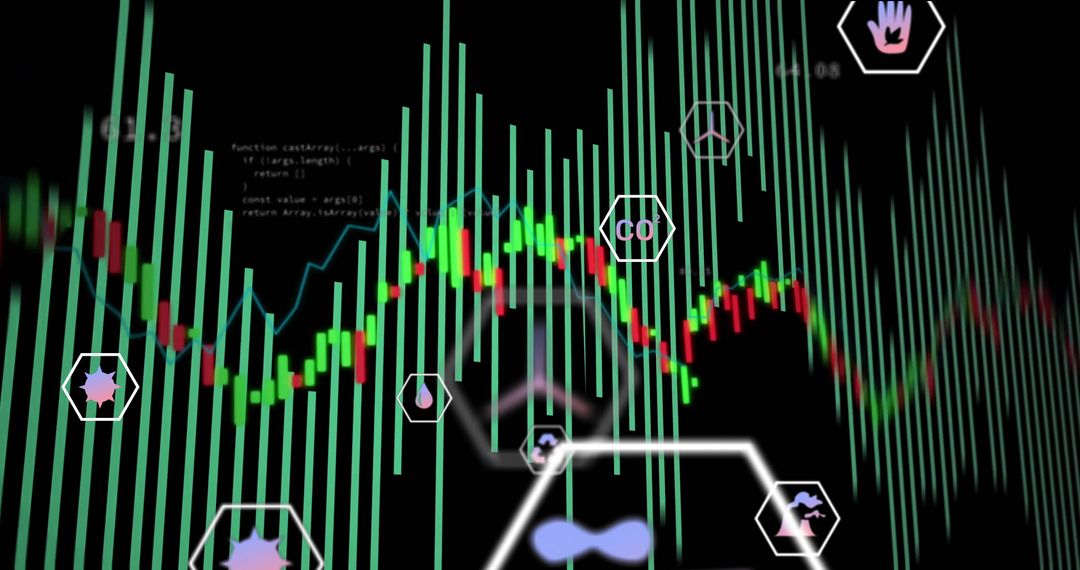
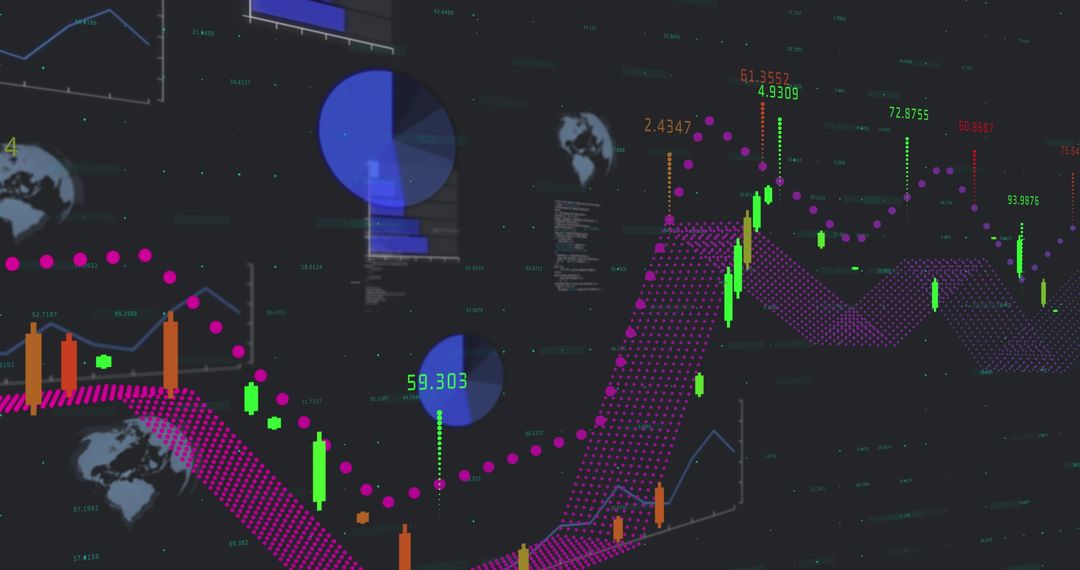
- Digital Trading Dashboard with Candlesticks and Analytics Symbols
Digital Trading Dashboard with Candlesticks and Analytics Symbols Image

Visual displaying digital trading dashboard showcasing candlesticks overlaid with green dotted line, coupled with various analytic icons. Represents intricate relation of data analysis in online trading scenarios. Suitable for use in financial articles, investment strategy showcases, technology firm presentations highlighting advanced trading tools.
Powered by 


0
downloads
downloads
Tags:
More
Credit Photo
If you would like to credit the Photo, here are some ways you can do so
Text Link
photo Link
<span class="text-link">
<span>
<a target="_blank" href=https://pikwizard.com/photo/digital-trading-dashboard-with-candlesticks-and-analytics-symbols/c68d01634a3d1c65c07a254aaa959568/>PikWizard</a>
</span>
</span>
<span class="image-link">
<span
style="margin: 0 0 20px 0; display: inline-block; vertical-align: middle; width: 100%;"
>
<a
target="_blank"
href="https://pikwizard.com/photo/digital-trading-dashboard-with-candlesticks-and-analytics-symbols/c68d01634a3d1c65c07a254aaa959568/"
style="text-decoration: none; font-size: 10px; margin: 0;"
>
<img src="https://pikwizard.com/pw/medium/c68d01634a3d1c65c07a254aaa959568.jpg" style="margin: 0; width: 100%;" alt="" />
<p style="font-size: 12px; margin: 0;">PikWizard</p>
</a>
</span>
</span>
Free (free of charge)
Free for personal and commercial use.
Author: Authentic Images
Similar Free Stock Images

Premium


Premium


Premium


Premium


Premium


Premium


Premium


Premium


Premium


Premium


Premium


Premium


Premium


Premium


Premium


Premium


Premium


Premium


Premium


Premium


Premium


Premium


Premium


Premium