- Home >
- Stock Photos >
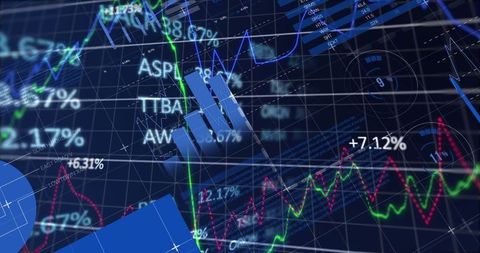
- Digital Trading Dashboard with Financial Data Visualization
Digital Trading Dashboard with Financial Data Visualization Image
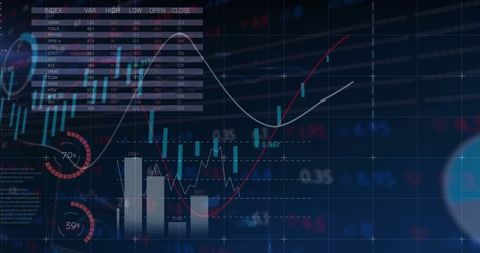
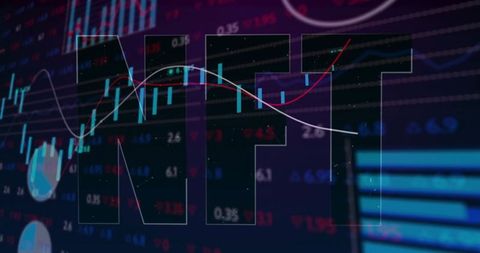
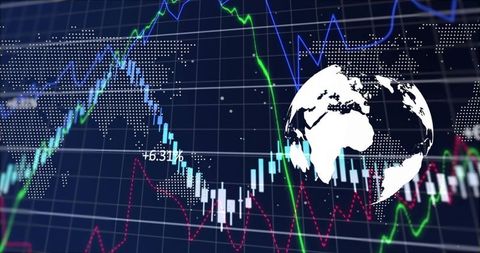
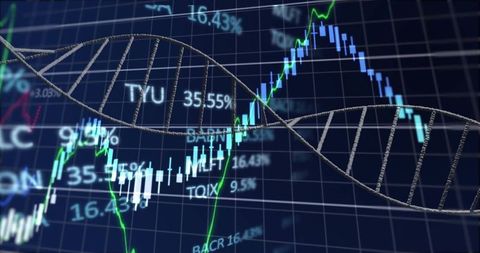
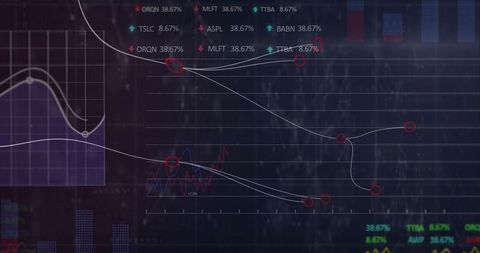
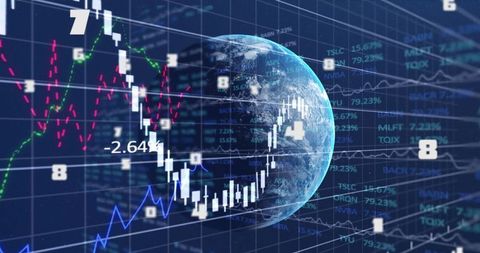
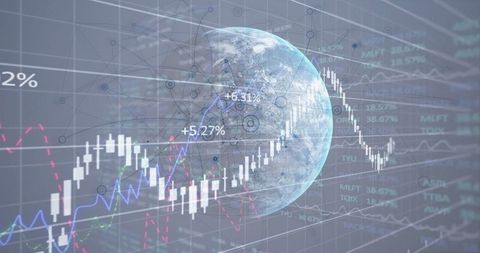
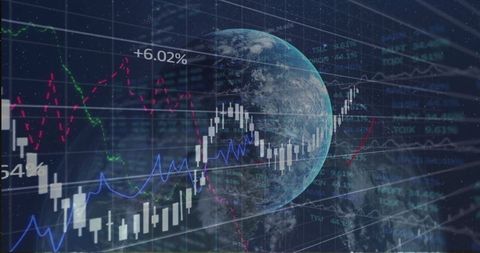
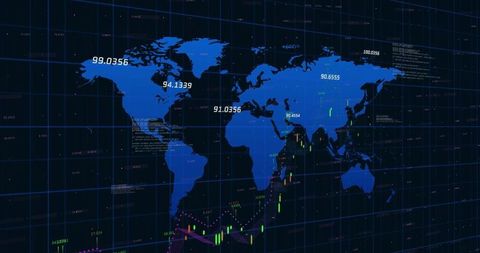
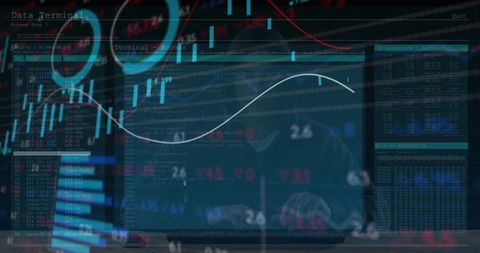
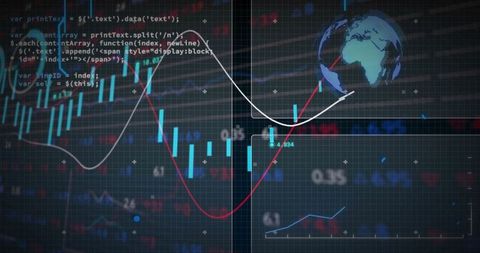
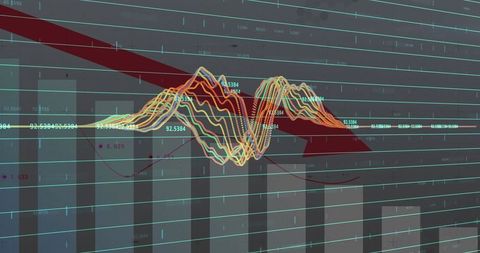
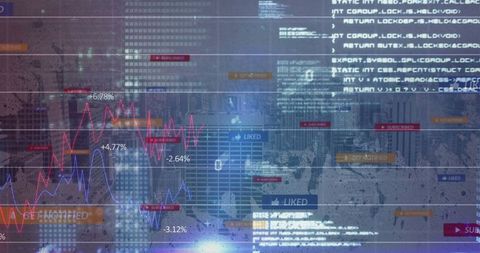
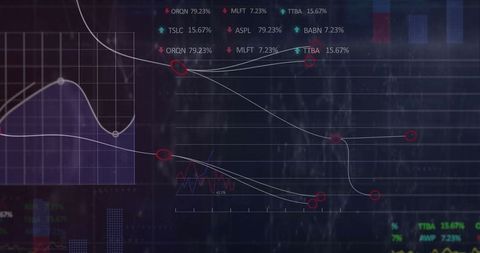
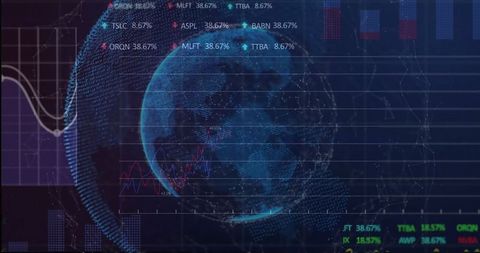
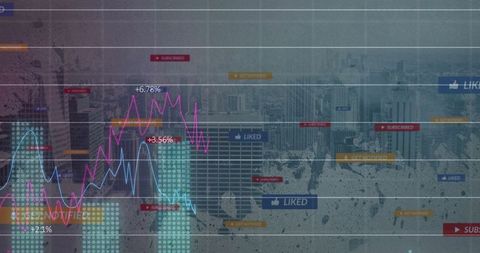
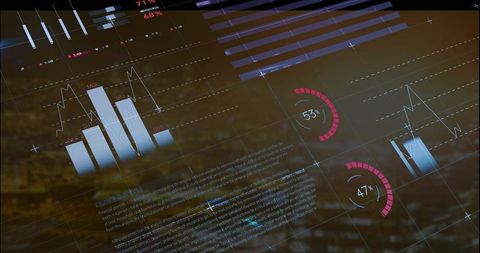
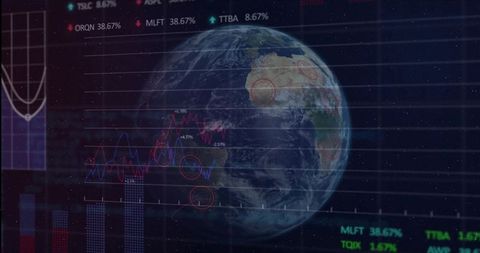
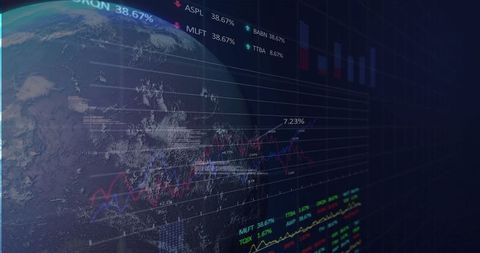
This digital display showcases various financial analytics including a candlestick chart, index table, and circular gauges. Ideal for depicting investment strategies, analyzing market trends, or examining financial data. Useful for reports, presentations, and content focused on finance and technology.

downloads
Tags:
More
Credit Photo
If you would like to credit the Photo, here are some ways you can do so
Text Link
photo Link
<span class="text-link">
<span>
<a target="_blank" href=https://pikwizard.com/photo/digital-trading-dashboard-with-financial-data-visualization/6ee5ef4910578709c7d0015262af3cdb/>PikWizard</a>
</span>
</span>
<span class="image-link">
<span
style="margin: 0 0 20px 0; display: inline-block; vertical-align: middle; width: 100%;"
>
<a
target="_blank"
href="https://pikwizard.com/photo/digital-trading-dashboard-with-financial-data-visualization/6ee5ef4910578709c7d0015262af3cdb/"
style="text-decoration: none; font-size: 10px; margin: 0;"
>
<img src="https://pikwizard.com/pw/medium/6ee5ef4910578709c7d0015262af3cdb.jpg" style="margin: 0; width: 100%;" alt="" />
<p style="font-size: 12px; margin: 0;">PikWizard</p>
</a>
</span>
</span>
Free (free of charge)
Free for personal and commercial use.
Author: People Creations