
- Home >
- Stock Photos >
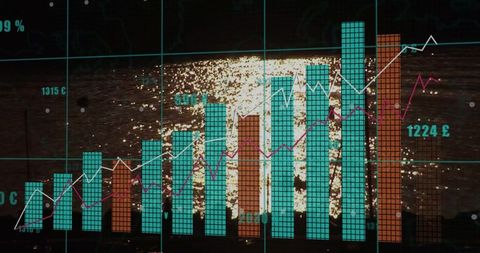
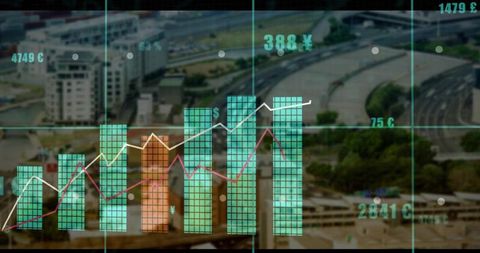
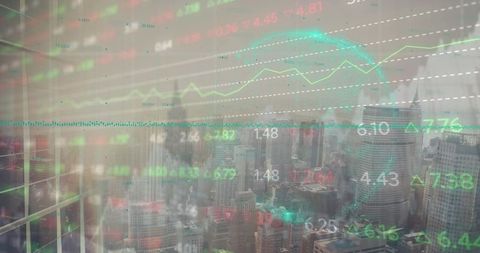
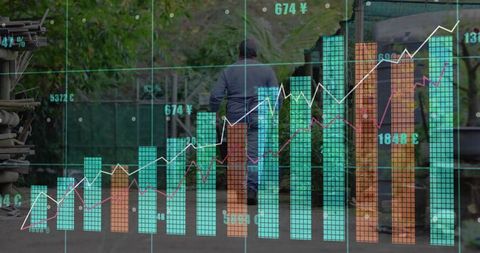
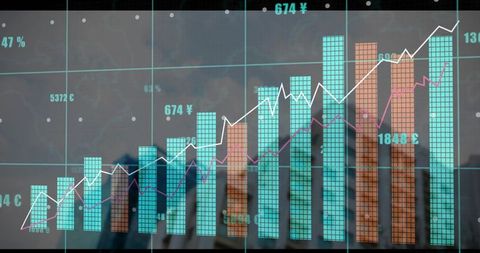
- Digital Trading Figures Against Urban Backdrop
Digital Trading Figures Against Urban Backdrop Image

This visualization displays a combination of bar and line graphs against an urban skyline, presenting financial and economic trends. The incorporation of currency symbols such as Yen and Pound on the graphs suggests international trading or stock market analytics. Ideal for use in business presentations, financial reports, and educational materials illustrating dynamic economic updates and insights.
Powered by  - Get 15% off with code: PIKWIZARD15


0
downloads
downloads
Tags:
More
Credit Photo
If you would like to credit the Photo, here are some ways you can do so
Text Link
photo Link
<span class="text-link">
<span>
<a target="_blank" href=https://pikwizard.com/photo/digital-trading-figures-against-urban-backdrop/135221bfdcfc5a4f2f8d224325207545/>PikWizard</a>
</span>
</span>
<span class="image-link">
<span
style="margin: 0 0 20px 0; display: inline-block; vertical-align: middle; width: 100%;"
>
<a
target="_blank"
href="https://pikwizard.com/photo/digital-trading-figures-against-urban-backdrop/135221bfdcfc5a4f2f8d224325207545/"
style="text-decoration: none; font-size: 10px; margin: 0;"
>
<img src="https://pikwizard.com/pw/medium/135221bfdcfc5a4f2f8d224325207545.jpg" style="margin: 0; width: 100%;" alt="" />
<p style="font-size: 12px; margin: 0;">PikWizard</p>
</a>
</span>
</span>
Free (free of charge)
Free for personal and commercial use.
Author: Awesome Content
Similar Free Stock Images
Loading...

Premium


Premium


Premium


Premium


Premium


Premium


Premium

Premium

Premium


Premium


Premium


Premium


Premium


Premium

Premium

Premium


Premium


Premium


Premium


Premium


Premium


Premium


Premium


Premium


Premium
