- Home >
- Stock Photos >
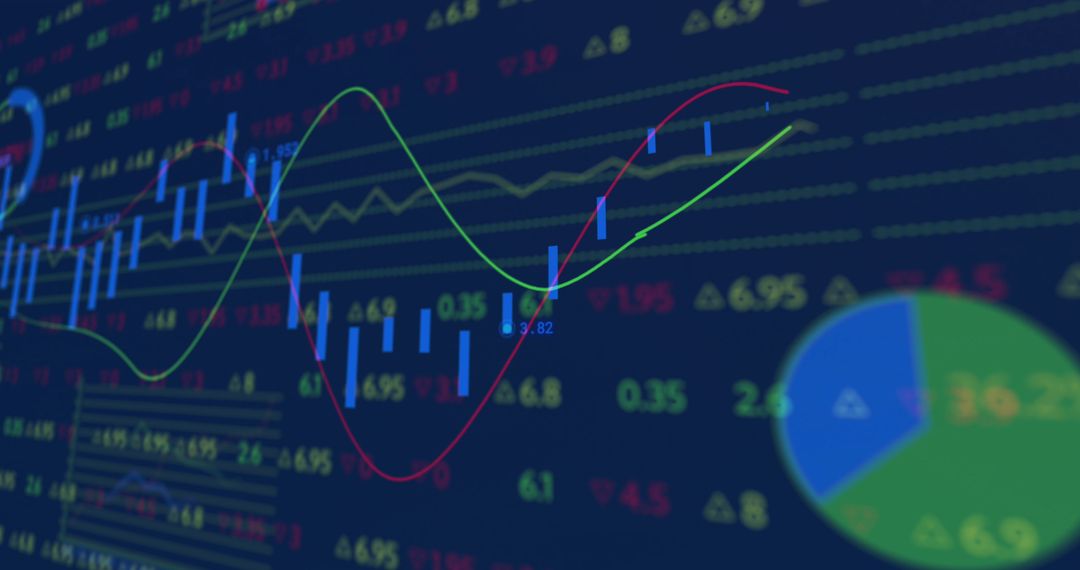
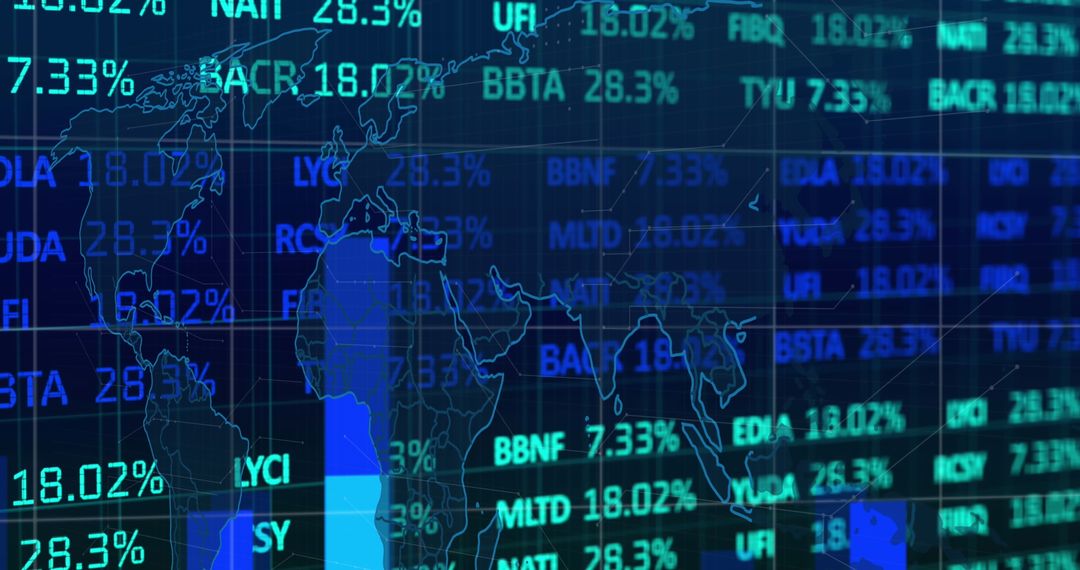
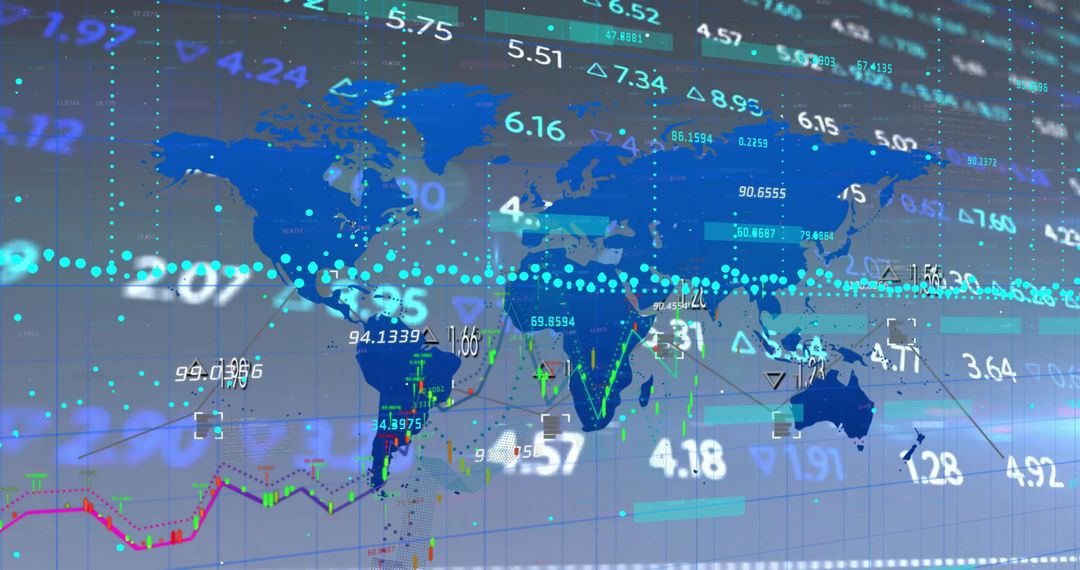
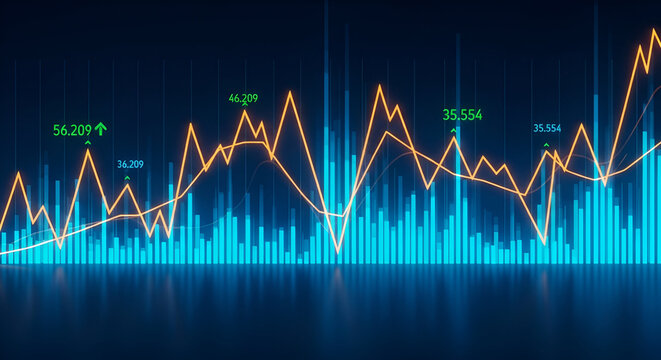
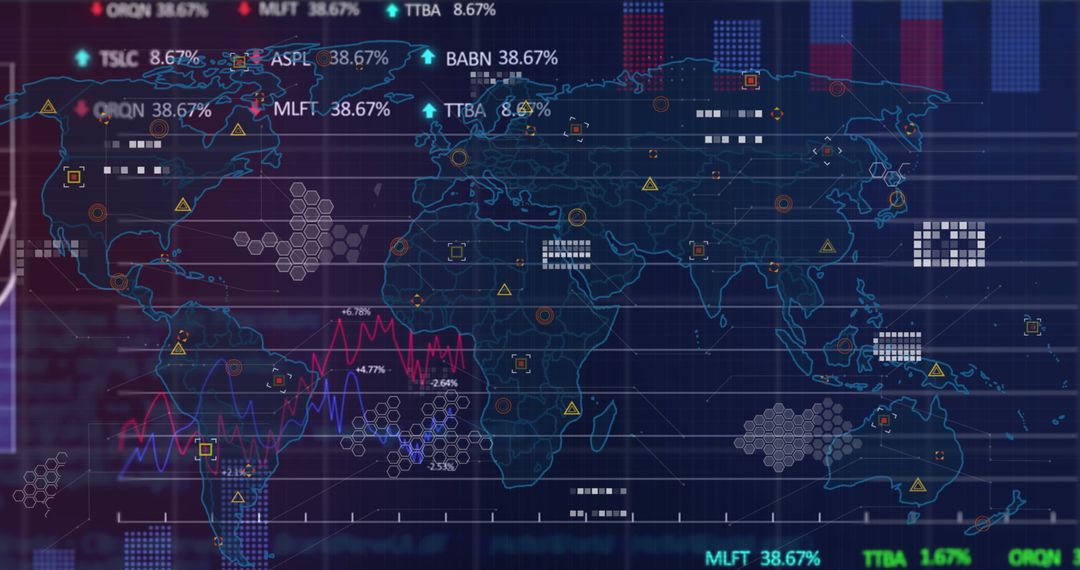
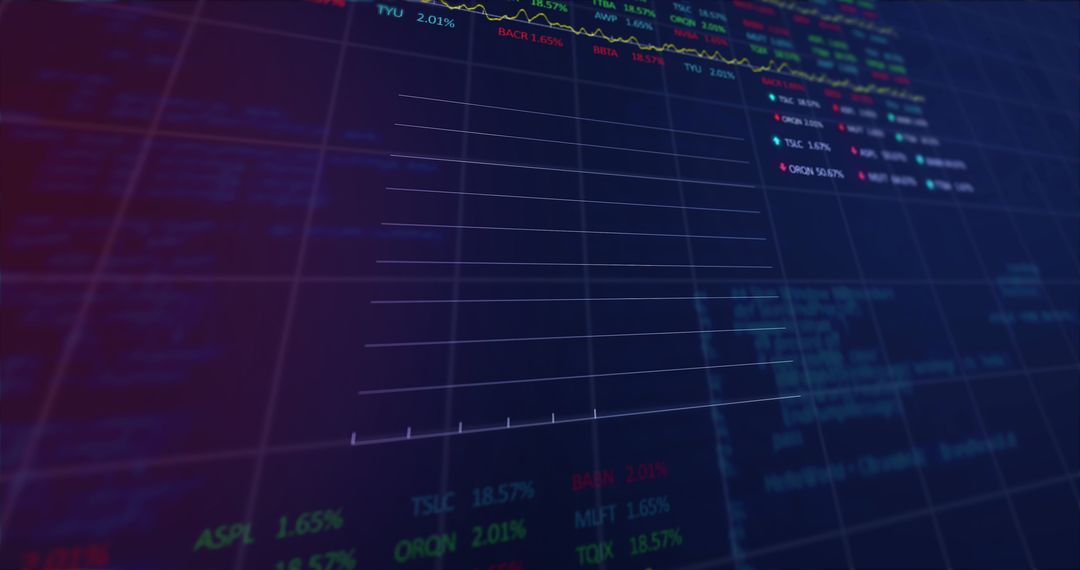
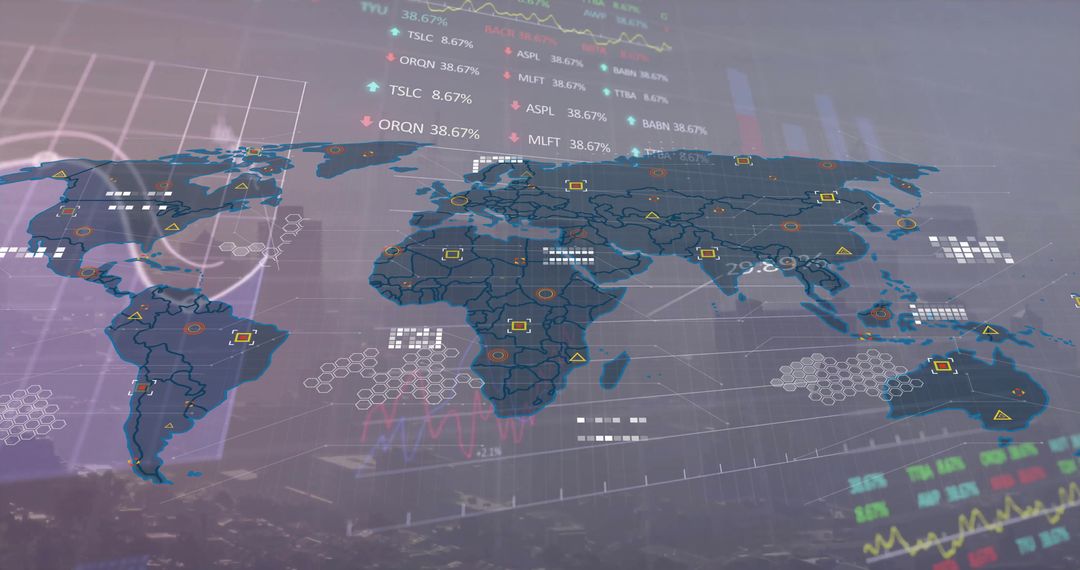
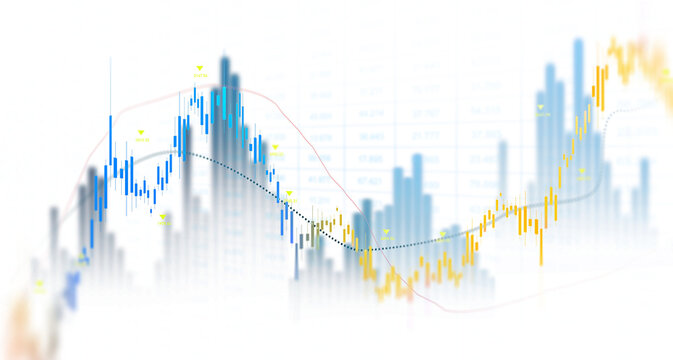
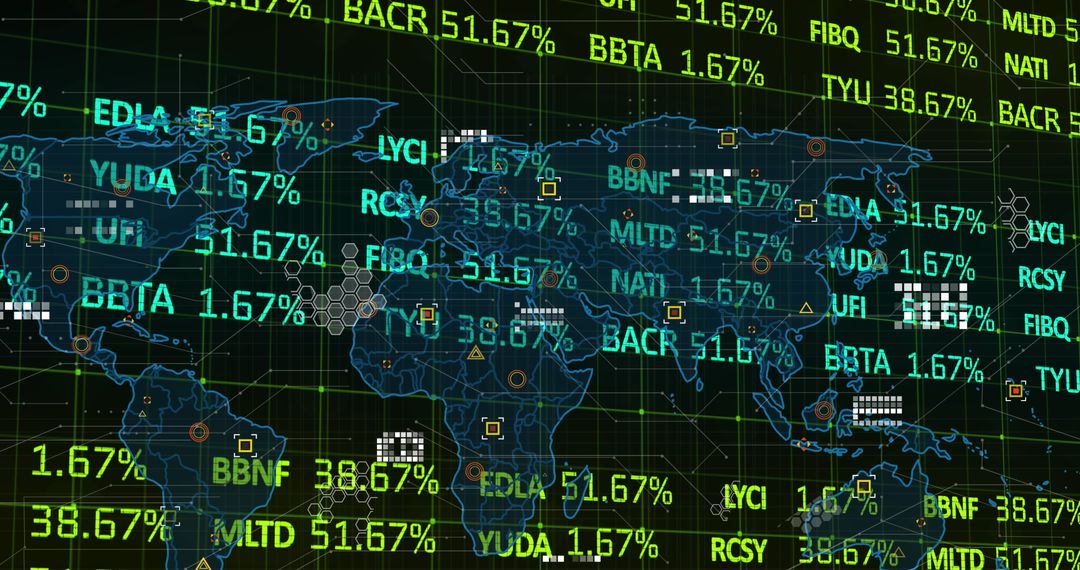
- Digital Trading Interface Showing Rising Financial Graph and Analytics
Digital Trading Interface Showing Rising Financial Graph and Analytics Image
AI Generated Image. Display features complex trading interface with rising line graph and analytics, reflecting trends in financial markets. This digital concept is valuable for financial reports, stock market analyses, business presentations, and investment seminars. Ideal for conveying themes of financial growth, technological investment, and market foresight.
Powered by 


0
downloads
downloads
Tags:
More
Credit Photo
If you would like to credit the Photo, here are some ways you can do so
Text Link
photo Link
<span class="text-link">
<span>
<a target="_blank" href=https://pikwizard.com/photo/digital-trading-interface-showing-rising-financial-graph-and-analytics/a08b9e3a863a7dcb174667d843bc4cb2/>PikWizard</a>
</span>
</span>
<span class="image-link">
<span
style="margin: 0 0 20px 0; display: inline-block; vertical-align: middle; width: 100%;"
>
<a
target="_blank"
href="https://pikwizard.com/photo/digital-trading-interface-showing-rising-financial-graph-and-analytics/a08b9e3a863a7dcb174667d843bc4cb2/"
style="text-decoration: none; font-size: 10px; margin: 0;"
>
<img src="https://pikwizard.com/pw/medium/a08b9e3a863a7dcb174667d843bc4cb2.jpg" style="margin: 0; width: 100%;" alt="" />
<p style="font-size: 12px; margin: 0;">PikWizard</p>
</a>
</span>
</span>
Free (free of charge)
Free for personal and commercial use.
Author: AI Creator
Similar Free Stock Images

Premium


Premium

Premium


Premium


Premium


Premium


Premium


Premium


Premium

Premium


Premium


Premium


Premium


Premium


Premium


Premium


Premium


Premium


Premium


Premium


Premium


Premium


Premium


Premium