- Home >
- Stock Photos >
- Digital Trading Interface with Candlestick and Line Graphs
Digital Trading Interface with Candlestick and Line Graphs Image

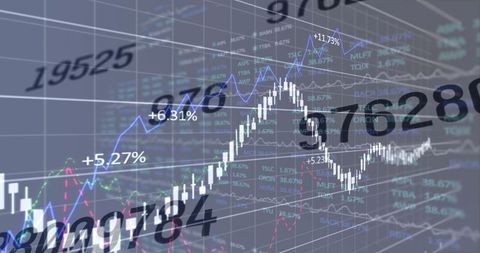
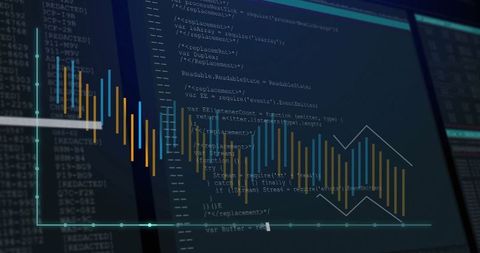
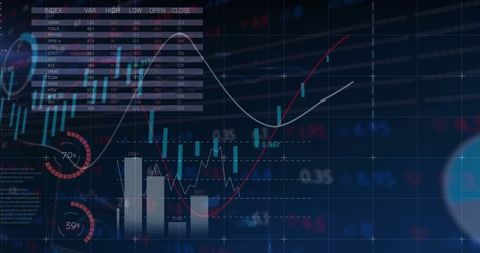
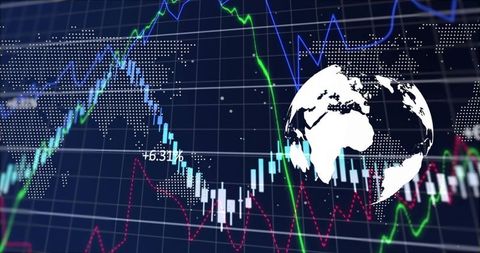
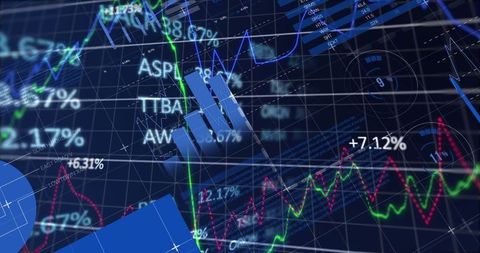
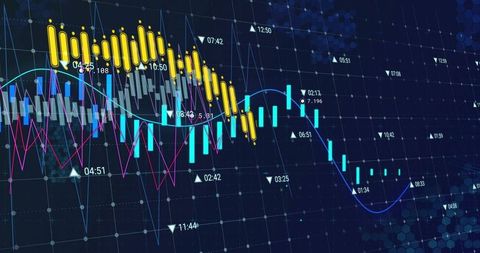
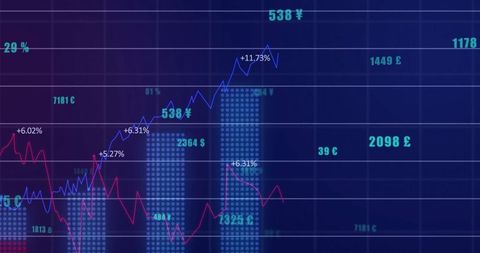
Shot shows a digital trading interface featuring candlestick bars interwoven with colorful line graphs, representing stock market activities and fluctuations. Illustration serves as a dynamic tool for presentations or articles about financial analysis, trading strategies, and digital finance tools. Suitable for use in publications focused on economic trends, investment guides, and fintech advancements.

downloads
Tags:
More
Credit Photo
If you would like to credit the Photo, here are some ways you can do so
Text Link
photo Link
<span class="text-link">
<span>
<a target="_blank" href=https://pikwizard.com/photo/digital-trading-interface-with-candlestick-and-line-graphs/4c96d5b0c9e431010a90c5bc99ca21f3/>PikWizard</a>
</span>
</span>
<span class="image-link">
<span
style="margin: 0 0 20px 0; display: inline-block; vertical-align: middle; width: 100%;"
>
<a
target="_blank"
href="https://pikwizard.com/photo/digital-trading-interface-with-candlestick-and-line-graphs/4c96d5b0c9e431010a90c5bc99ca21f3/"
style="text-decoration: none; font-size: 10px; margin: 0;"
>
<img src="https://pikwizard.com/pw/medium/4c96d5b0c9e431010a90c5bc99ca21f3.jpg" style="margin: 0; width: 100%;" alt="" />
<p style="font-size: 12px; margin: 0;">PikWizard</p>
</a>
</span>
</span>
Free (free of charge)
Free for personal and commercial use.
Author: Authentic Images