
- Home >
- Stock Photos >
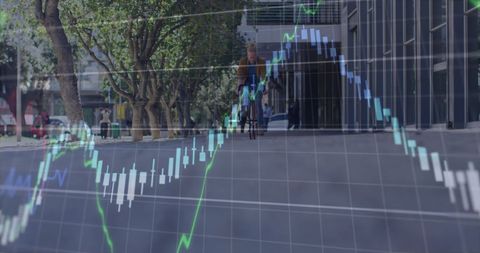
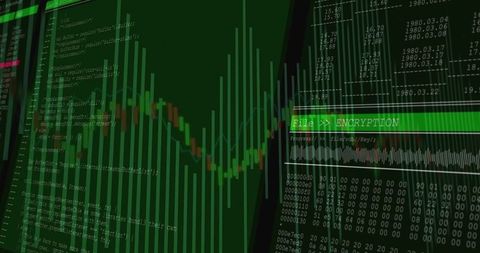
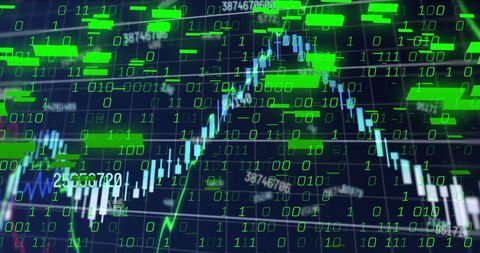
- Digital Trading Interface with Candlesticks and Data Graphs
Digital Trading Interface with Candlesticks and Data Graphs Image

Digital display picturing a complex trading interface featuring candlesticks, graphs, and data points overlaid in translucent style. Perfect for illustrating themes of finance, technology, or stock investments. Useful in presentations about data analytics, investment strategies, or startup financial analysis.
Powered by  - Get 15% off with code: PIKWIZARD15


downloads
Tags:
More
Credit Photo
If you would like to credit the Photo, here are some ways you can do so
Text Link
photo Link
<span class="text-link">
<span>
<a target="_blank" href=https://pikwizard.com/photo/digital-trading-interface-with-candlesticks-and-data-graphs/56a42148ced40a9a03b22dba9a32cb28/>PikWizard</a>
</span>
</span>
<span class="image-link">
<span
style="margin: 0 0 20px 0; display: inline-block; vertical-align: middle; width: 100%;"
>
<a
target="_blank"
href="https://pikwizard.com/photo/digital-trading-interface-with-candlesticks-and-data-graphs/56a42148ced40a9a03b22dba9a32cb28/"
style="text-decoration: none; font-size: 10px; margin: 0;"
>
<img src="https://pikwizard.com/pw/medium/56a42148ced40a9a03b22dba9a32cb28.jpg" style="margin: 0; width: 100%;" alt="" />
<p style="font-size: 12px; margin: 0;">PikWizard</p>
</a>
</span>
</span>
Free (free of charge)
Free for personal and commercial use.
Author: Awesome Content
Similar Free Stock Images

Premium


Premium


Premium


Premium


Premium


Premium

Premium

Premium


Premium


Premium


Premium


Premium


Premium


Premium


Premium


Premium


Premium


Premium


Premium


Premium


Premium


Premium


Premium


Premium

Premium


Explore More Free Stock Images