1. Home > 
  2. Stock Photos > 
  3. Digital Trading Interface with Chart and Data Visualization

Digital Trading Interface with Chart and Data Visualization Image

Digital Trading Interface with Chart and Data Visualization

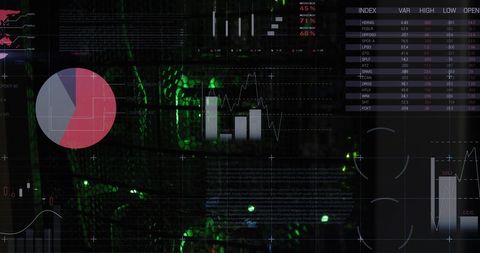
This illustrates a modern digital trading interface exhibiting a green dotted chart and candlestick graphs. Including real-time numerical data, magenta user icon, and chat bubble, it serves professionals monitoring stock markets and financial trends. Applicable for fintech presentations, financial analysis models, stock analysis education, trading platforms, and investment portfolio reviews.

Powered by Shutterstock logo - Get 15% off with code: PIKWIZARD15
Stock market graph trading analysis investment financial, stock exchange financial or forex graph stock market graph chart business crisis crash loss and grow up gain and profits win up trend - Powered by Shutterstock - Get 15% off with code: PIKWIZARD15Stockmarket online trading chart candlestick on crypto currency platform. Stock exchange financial market price candles graph data pattern analysis concept. Computer screen closeup background - Powered by Shutterstock - Get 15% off with code: PIKWIZARD15Stock market graph trading analysis investment financial, stock exchange financial or forex graph stock market graph chart business crisis crash loss and grow up gain and profits win up trend - Powered by Shutterstock - Get 15% off with code: PIKWIZARD15Stock market chart with green candlesticks going up indicating crypto rising in value. Graphical representation of volumes and time intervals of digital cryptocurrency past price movements - Powered by Shutterstock - Get 15% off with code: PIKWIZARD15Young woman working at night modern office.Technical price graph and indicator, red and green candlestick chart and stock trading computer screen background. Double exposure.Wide - Powered by Shutterstock - Get 15% off with code: PIKWIZARD15

Credit Photo

If you would like to credit the Photo, here are some ways you can do so

Free (free of charge)

Free for personal and commercial use.

Author: Awesome Content

Similar Free Stock Images

Global Financial Data Over World Map in Office Setting
Premium
Stock market growth vector with green candlestick chart and rising lines. Ideal for illustrating profit, success, investment growth, financial gain, and bullish economic trends in business media.
Global Bitcoin Cryptocurrency Trends Amidst Political Unrest
Financial Data Overlay on Cityscape Conceptual Image
Abstract Digital Data Processing Background with Graphs
Navigating Global Business Strategy with Advanced Data Analytics
Premium
Stock market graph trading analysis investment financial, stock exchange financial or forex graph stock chart graph business crisis crash loss and grow up gain and profits win up trend growth money
Cybersecurity in Global Finance with Digital Network
Digital Data Streams and Circuit Board Imagery Concept
Financial Data Overlay on Cityscape Technology Concept
Futuristic Financial Data Analysis on Multiple Screens
Premium
Indicator, red and green candlestick chart on blue theme screen, market volatility, up and down trend. Stock trading, crypto currency background.
Digital Stock Market Data with Fluctuating Numbers and Graphs
Digital Financial Data Overlay on Modern Office Interior
Financial Data Analytics and Global Cityscape with Futuristic Display
Circuit Board Overlaid on Data Server System Visuals
Premium
Green candlestick chart overlay, person analyzing data on laptop using a stylus, dark background. Concept of stock market and financial trading
Futuristic Financial Data Analytics Digital Interface
Digital Interface Overlaid on Retail Environments Reflecting Market Data
Abstract Digital Data Interface and Global Business Analytics
Digital Data Visualization with Financial Charts in Technology Interface
Premium
Diagram representing red crashing stock market volatility of crypto trading, where red candlesticks going down without resistance, market fear and downtrend on blue display background
Fingerprint Authentication Over Digital Screens and Data Streams
Coding and Data Analytics with a 3D Bar Chart and Screens
Digital Trading Dashboard with Candlestick Charts and Global Data
Futuristic Digital Dashboard With Neon Crypto Text and Analytics
Premium
Businessperson Analyzing Stock Market Data on Laptop with Green Upward Arrow and Candlestick Chart, Representing Financial Growth, Investment Success, and Economic Progress in Digital Trading
Global Data Visualization: Candlestick Chart and Trend Analysis
Global Night Map with Digital Financial Analytics Overlay
Digital Data Visualization on Advanced Analytics Dashboard
Futuristic Data Analytics Dashboard in Digital Interface
Biohazard Sign with Global Finance and COVID-19 Data
Global Finance Panning over City Traffic Lights
Premium
Business team working together at night office.Technical price graph and indicator, red and green candlestick chart and stock trading computer screen background. Double exposure.
Dynamic Data Overlay with Futuristic Digital Interface
Futuristic Digital Display with QR Codes and Data Visualizations
Financial Data Processing with Dynamic City Lights Overlay
Colorful Graph Displaying Stock Market Trends on Digital Grid
Premium
Digital money movement chart with crypto
Digital Data Visualization with Dynamic Stock Market Charts
Digital Data With Eco Icons Highlighting Environmental Impact
Global Financial Data Analysis with Digital Graphics
Rising Global Markets Trend with Data Visualization
Premium
Two professional traides looking on technical price graph and indicator, red and green candlestick chart and stock trading computer screen background. Double exposure
Statistical Data Visualizations on Office Background
Abstract Financial Data Visualized Over World Map
Digital Innovation in Data Center Processing and Storage
Dynamic Stock Market Data over Vibrant Purple Background
Premium
Stock exchange online trading platform chart candlesticks bars, tickers digital data on crypto currency trade financial market platform. Stockmarket graph statistic. Computer screen closeup background
Global Financial Analysis Digital Display with World Map Overlay
Abstract Digital World Map with Stock Market Data Visualization
Digital Data Analytics Visualization on Abstract Interface
Digital Financial Data on Abstract Technology Interface
Premium
Business woman sitting at night office in front laptop computer and using her mobile phone. Red and green candlestick chart and stock trading computer screen background. Double exposure. Wide
World Map with Data Overlay on Finance Dashboard
Modern Financial Office Data Overlap with Technology Insights
Futuristic Financial Interface with Data Analytics and Charts
Futuristic Digital Trading Dashboard with Rising Arrow
Premium
Young woman working at modern office.Technical price graph and indicator, red and green candlestick chart and stock trading computer screen background. Double exposure. Trader analyzing data
Futuristic Trading Dashboard with Data Visualization Elements
Futuristic Data Interface with Green Digital Matrix Dashboard
Sustainability Tracking with Digital Dashboard Interface
Futuristic Data and Statistics Interface in Modern Server Room
Abstract Financial Data Visualization with City Lights
Digital Data Analysis and Processing in Technological Environment
Premium
Business team working together at night office.Technical price graph and indicator, red and green candlestick chart and stock trading computer screen background. Double exposure.
Data Processing Digital Interface with Neon Graphs and Code
Digital Financial Data Visualization in Urban Landscape
Global Stock Market Graph on a Digital World Map
Abstract Global Financial Data Processing Over World Map
Premium
Young woman working at modern office.Technical price graph and indicator, red and green candlestick chart and stock trading computer screen background. Double exposure. Trader analyzing data
Digital Data Processing with Global Interface Connections
Financial Data Streams and City Traffic Concept
Data Processing Interface in a Computer Server Room
Digital Financial and Statistical Data Display Technology
Premium
Stock market graph on the screen. Investing and concept gain and profits with faded candlestick charts. Candle stick graph chart. Stock market chart, graph on blue background.
Digital Icons Over Financial Data on Black Background
Futuristic Digital Interface with Global Data Analytics Design
Digital Communication Technology with Data Code Elements
Global Market Trends with Rising Indicators on World Map
Premium
Stock market graph trading analysis investment financial, stock exchange financial or forex graph stock chart graph business crisis crash loss and grow up gain and profits win up trend growth money
Innovative Fusion of Science and Finance with Digital Data Visualization
Dynamic Financial Data Chart with Abstract Geometric Network
Digital Data Processing Interface with Global Connections Theme
3D Stagflation Text in Futuristic Economic Data Display
Premium
Stock market online trading chart candlestick on cryptocurrency platform. Computer screen close-up background. Stock exchange financial market price candles graph data pattern analysis concept.
Dynamic Financial Chart with Neon Candlestick Bars
Digital Data Visualization with Trend Analysis and Interactive Charts
Digital Network Connecting Data Nodes with Green Candlesticks
Futuristic 3D Green Waveform Display on Trading Application
Premium
Smiling woman in pink blouse reviewing data in gray upholstered booth, candlestick chart and stylus. Financial analysis, digital trading, professional environment, business intelligence
Financial Data Charts Blended with Programming Code on Dark Background
Neon 3D Financial Dashboard Visualizing Rising Market Trend with Candlesticks and Gauge
Advanced Financial Data Processing Chart Visualization
Dynamic Visualization of Financial Markets on Dark Background
Blending Digital Data Visualizations with Modern Cityscape
Digital Interface Overlay on Financial Data with Server Room Background
Premium
The market volatility of crypto trading with technical price graph and indicator, red and green candlesticks, for analysis up and downtrend. Stock trading, crypto currency background concept.
Dynamic Financial Data Processed Amid City Lights at Night
Digital Global Stock Market Analysis Over World Map
Digital Interface of Data Streams and Technology Icons on Dark Background
Digital Fluorescent Data Visuals Overlapping Cityscape Silhouette
Premium
The market volatility of crypto trading with technical price graph and indicator, red and green candlesticks, for analysis up and downtrend. Stock trading, crypto currency background concept.
Global Financial Map with Digital Data and Graph Overlays
Financial Data Analysis in Empty Office
Digital Financial Data Processing with Global Connectivity
Digital Security Overlaying Financial Graphs and Analytics
Premium
Stockmarket online trading chart candlestick on crypto currency platform. Stock exchange financial market price candles graph data pattern analysis concept. Computer screen closeup background
Futuristic Data Processing Interface with Digital Graphs
Global Financial Data Overlaid on Blurred City Lights
Financial Data Visualization over World Map with Digital Interface
Global Financial Data Analysis Over Digital World Map
Premium
green candlesticks going up indicating crypto rising in value. Graphical representation of volumes and time intervals
Digital Financial Data Visualization Over World Map
Digital Financial Data Graphs with Futuristic Design
Digital Trade Success with Floating Thumbs Up Among Green Charts
NFT Technology and Global Cryptocurrency Analysis Visualization
Premium
Financial growth concept showing rising stock charts, green candlesticks, and an upward arrow on a laptop screen, representing investment success, market trends, analytics, and digital trading.
Futuristic Digital Interface Dashboard with Virtual Data Panels
Analytics Numbers Visualized in Neon with Trading Interface Elements
Abstract Digital Financial Chart with Neon Candlesticks
Digital Trading Dashboard with Candlesticks and Analytics Symbols
Premium
Double exposure.Market traider making analysis of digital market and investment in block chain crypto currency. Red and green candlestick chart and stock trading computer screen background
Futuristic financial data visualizing neon candlesticks and dotted peaks over world map