
- Home >
- Stock Photos >
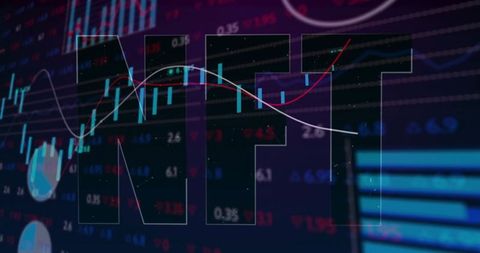
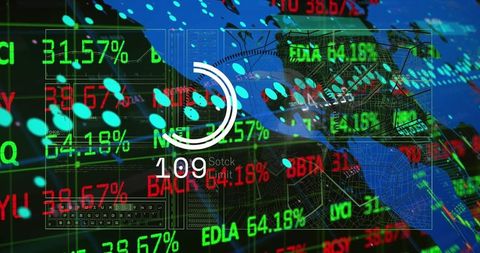
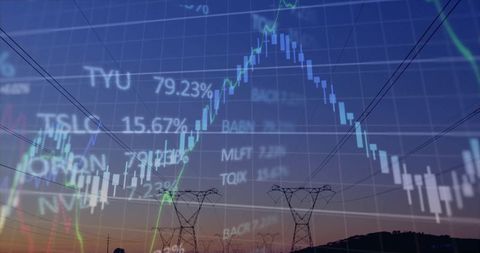
- Digital Trading Interface with Financial Graphs and Data Overlay
Digital Trading Interface with Financial Graphs and Data Overlay Image

This image presents an abstract digital trading interface simulating the experience of a financial monitoring setup. It is great for illustrating concepts of finance, technology, and cybersecurity. The blue and dark hues emphasize digital advancement and modern analytical processes. It can be utilized in financial presentations, technology articles, or cyberspace-related educational materials.
Powered by  - Get 15% off with code: PIKWIZARD15


downloads
Tags:
More
Credit Photo
If you would like to credit the Photo, here are some ways you can do so
Text Link
photo Link
<span class="text-link">
<span>
<a target="_blank" href=https://pikwizard.com/photo/digital-trading-interface-with-financial-graphs-and-data-overlay/a9f2a7a4f4b7a6d8e27d0be59679504d/>PikWizard</a>
</span>
</span>
<span class="image-link">
<span
style="margin: 0 0 20px 0; display: inline-block; vertical-align: middle; width: 100%;"
>
<a
target="_blank"
href="https://pikwizard.com/photo/digital-trading-interface-with-financial-graphs-and-data-overlay/a9f2a7a4f4b7a6d8e27d0be59679504d/"
style="text-decoration: none; font-size: 10px; margin: 0;"
>
<img src="https://pikwizard.com/pw/medium/a9f2a7a4f4b7a6d8e27d0be59679504d.jpg" style="margin: 0; width: 100%;" alt="" />
<p style="font-size: 12px; margin: 0;">PikWizard</p>
</a>
</span>
</span>
Free (free of charge)
Free for personal and commercial use.
Author: Authentic Images
Similar Free Stock Images

Premium


Premium


Premium


Premium


Premium


Premium


Premium


Premium


Premium


Premium


Premium


Premium


Premium


Premium


Premium


Premium


Premium


Premium


Premium


Premium


Premium


Premium


Premium


Premium


Premium


Explore More Free Stock Images