
- Home >
- Stock Photos >
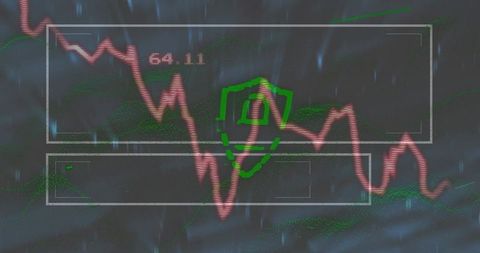
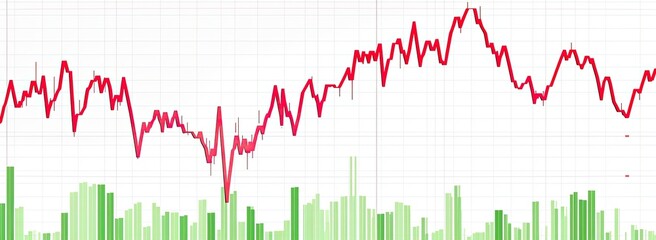
- Digital Trading Interface with Red Fluctuating Line Graph
Digital Trading Interface with Red Fluctuating Line Graph Image

Image of a digital trading interface highlighting a red fluctuating line graph, symbolizing the volatility of stock market trends. It features a numeric label of 64.11, suggesting a snapshot capturing ongoing financial data analysis. Useful for articles or reports delving into financial themes, stock market behavior, investment strategies, or technological aspects of trading interfaces.
Powered by 


downloads
Tags:
More
Credit Photo
If you would like to credit the Photo, here are some ways you can do so
Text Link
photo Link
<span class="text-link">
<span>
<a target="_blank" href=https://pikwizard.com/photo/digital-trading-interface-with-red-fluctuating-line-graph/cc47f2b808cce6d7cfb69d43426b05e2/>PikWizard</a>
</span>
</span>
<span class="image-link">
<span
style="margin: 0 0 20px 0; display: inline-block; vertical-align: middle; width: 100%;"
>
<a
target="_blank"
href="https://pikwizard.com/photo/digital-trading-interface-with-red-fluctuating-line-graph/cc47f2b808cce6d7cfb69d43426b05e2/"
style="text-decoration: none; font-size: 10px; margin: 0;"
>
<img src="https://pikwizard.com/pw/medium/cc47f2b808cce6d7cfb69d43426b05e2.jpg" style="margin: 0; width: 100%;" alt="" />
<p style="font-size: 12px; margin: 0;">PikWizard</p>
</a>
</span>
</span>
Free (free of charge)
Free for personal and commercial use.
Author: Authentic Images
Similar Free Stock Images

Premium

Premium

Premium


Premium


Premium


Premium


Premium


Premium


Premium

Premium

Premium


Premium


Premium


Premium


Premium


Premium


Premium


Premium


Premium


Premium


Premium


Premium


Premium

Premium


Premium


Explore More Free Stock Images