1. Home > 
  2. Stock Photos > 
  3. Digital Trading Screen with Candlestick Bars and World Map Overlay

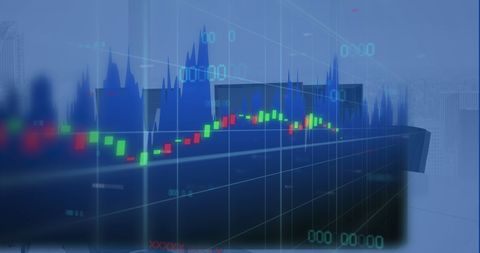
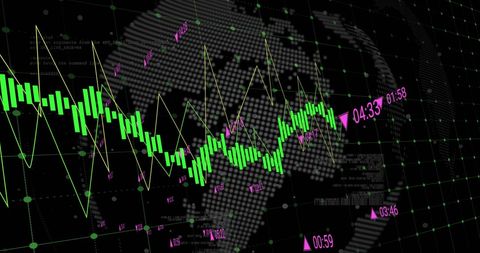
Digital Trading Screen with Candlestick Bars and World Map Overlay Image

Digital Trading Screen with Candlestick Bars and World Map Overlay

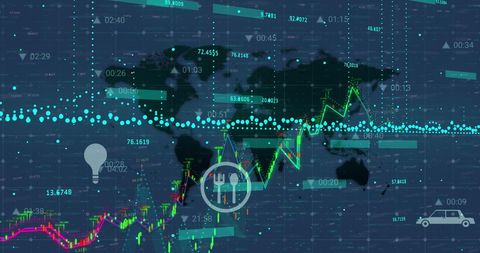
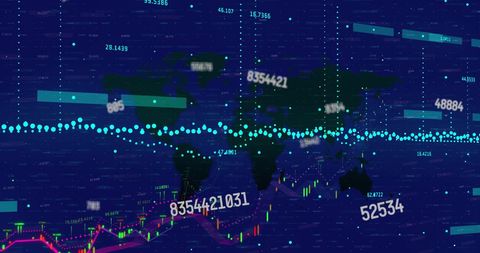
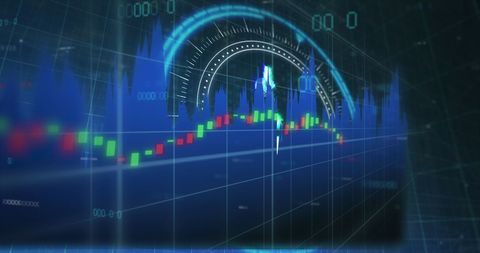
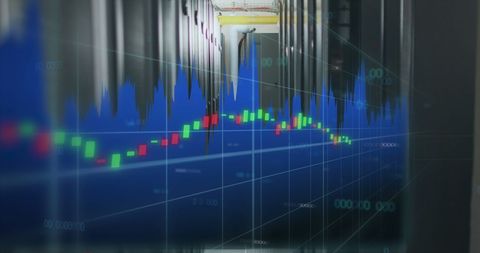
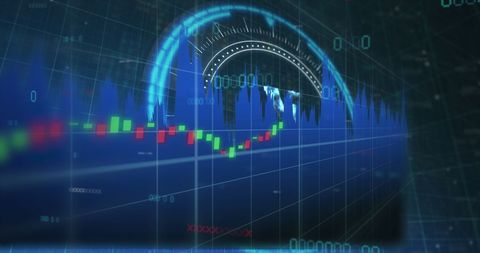
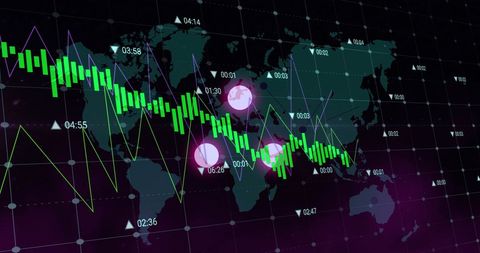
This depiction of a trading screen features classic candlestick bars intertwined with an area graph, effectively conveying complex financial data. The overlay of a global map aligns with themes of global trading and economics. Ideal for illustrating concepts of stock exchange, financial analytics, investment discussions, or digital trading technology, this could enhance business presentations, financial analysis reports, or articles about economic trends and financial technology advancements.

Powered by Shutterstock logo - Get 15% off with code: PIKWIZARD15
Stock market graph trading analysis investment financial, stock exchange financial or forex graph stock market graph chart business crisis crash loss and grow up gain and profits win up trend - Powered by Shutterstock - Get 15% off with code: PIKWIZARD15Stockmarket online trading chart candlestick on crypto currency platform. Stock exchange financial market price candles graph data pattern analysis concept. Computer screen closeup background - Powered by Shutterstock - Get 15% off with code: PIKWIZARD15Bangkok night cityscape and forex stock market hologram, candlesticks dynamics and statistics, bar chart with numbers. Concept of money investment, trading and profit - Powered by Shutterstock - Get 15% off with code: PIKWIZARD15Stock market graph trading analysis investment financial, stock exchange financial or forex graph stock market graph chart business crisis crash loss and grow up gain and profits win up trend - Powered by Shutterstock - Get 15% off with code: PIKWIZARD15Displaying grid overlay in trading room, with ticker symbols, line graphs and candlestick bars. Financial, data, analysis, technology, digital, modern, investment - Powered by Shutterstock - Get 15% off with code: PIKWIZARD15

Credit Photo

If you would like to credit the Photo, here are some ways you can do so

Free (free of charge)

Free for personal and commercial use.

Author: Authentic Images

Similar Free Stock Images

Financial Data Processing with Mathematical Formulae Interface
Premium
Candlestick chart in financial stock market on digital number background. Forex trading graphic design and Stock market trading trend as concept.
Global Cryptocurrency Trading with Bitcoin and Data Analytics
Global Financial Data Interface with Rotating Globe Overlay
Digital Data Processing Overlaid on Globe Network Interface
Financial Graphs with Cityscape Background Reflecting Market Trends
Premium
Businesswoman and businessman portraits, double exposure stock market candlesticks with lines, glowing forex diagrams. Concept of trading and consulting. Copy space
Digital Display of Yen Currency with Market Trader Graph
Digital Future of Global Data and Financial Trends
Dynamic Financial Graphs Over Office Workspace
Financial Graph Overlay on Global Digital Interface
Premium
Floating chart showing candlestick bars and line graph above sea with grid plane, percentage labels. Financial, data, visualization, analysis, technology, digital, innovation
Global Finance Analysis with Digital Interface Overlay
Dynamic Analysis of Stock Market Trends and Patterns
Digital Financial Chart Showing Growth and Dynamic Indicators
Data Processing with Graphs on Computer Servers Concept
Premium
Displaying financial data over trading floor, with multicolor candlesticks, graphs and data points. Financial, analytics, modern, technology, business, investment, digital
Graphical Data Analysis on Digital Interface
Digital Interface with Data Processing and Business Connectivity Icons
Financial Data Visualization with Infographics and Graphs
Water Cascade Over Trading Board with Financial Graphs Overlay
Premium
Stock market graph trading analysis investment financial, stock exchange financial or forex graph stock chart graph business crisis crash loss and grow up gain and profits win up trend growth money
Global Business Finance Data Analysis Visualization
Financial Data and Stock Market Trends Overlaying Cityscape
Global Data Projection Showing Stock Market Trends with Digital Globe
Global Stock Market Chart Over World Map
Premium
Showing green lettuce heads in digital interface, with pink candlestick bars overlaying line graphs. Fresh produce, financial analytics, digital visualization, health food, data science
Global Stock Market Analysis with Digital Interface Over World Map
Abstract Digital Financial Data Analysis Concept
Digital Trading Interface with Candlesticks and Data Graphs
Futuristic Digital Dashboard with Neon Line Charts Analysis
Global Financial Data and Digital Analysis Interface
Digital Financial Data and Stock Market Charts
Premium
A hand holds a financial graph displaying upward market trends from 2021 to 2025 with candlestick patterns, on a dark background, symbolizing financial forecasting and future growth
Dynamic Stock Market and Financial Data Analysis Concept
Abstract Financial Data Through Graphic Overlays
Dynamic Financial Data Display Over Global Stock Market
Global Financial Market Data with World Map
Premium
Stock market online trading chart candlestick on cryptocurrency platform. Computer screen close-up background. Stock exchange financial market price candles graph data pattern analysis concept.
Construction Site Merged with Digital Financial Graph Overlay
Abstract Financial Data with Multi-Screen Office Setup
Holographic Battery Icon Over Stock Market Trading Board
Stock Market Data Analysis with Digital Security Element
Premium
Businesswoman using tablet, double exposure forex trading and analysis. Bangkok city skyline and empty copy space white background. Concept of consulting and investment
Abstract Financial Data with Digitally Enhanced Graphs
Global Data Analysis with World Map and Pulse Wave
Colombian Stock Market Data Amid Colored Background
Dynamic Financial Data Analysis with Market Charts
Premium
Displaying numeric chart in trading interface, with candlestick, bar, line, pie and arrow elements. Analytics, data visualization, finance, digital interface, investment, market analysis, economic
Global Data Processing on Digital Earth Background
Digital Data and Statistics with Global Financial Concept
Illuminated Financial Data Chart Display on Dark Backdrop
Global Financial Data Display on World Map Background
Premium
Displaying candlestick bars and wave line graph in trading interface, with numeric labels and grid. Futuristic, technology, analytics, visualization, innovation, financial, digital
Abstract Financial Data Over Cityscape Imagery
Global Financial Data Overlay with Coding Elements
Futuristic Financial Data Chart with Virtual Interface
Digital Data Overlay on Cityscape Reflecting Global Business Trends
Premium
Magnifying glass focus on technical graph analyzing stock market profit trend. Businessman hand holding magnifier and zooming rising bar chart. Business economy and financial growth concept.
Global Financial Trends on Digital World Map Display
Digital Financial Chart with Candlestick Bars and Analytics
Futuristic Digital Dashboard with Blue Graphs and Eco Icons
Dynamic Financial Data Elements on Abstarct Grid
Digital Data Visualization with Global Financial Trends
Futuristic Data Visualization with Financial Statistics
Premium
Growth property price and real estate concept with digital graphic stats data and raising up diagram on city skyscraper tops background bottom view, double exposure
Global Financial Analysis Over Neon Cityscape
Dynamic Financial Data Processing Showing Stock Market Interface
Global Financial Data and Statistics Over World Map
Digital Stock Market Analysis and Financial Data Visualization
Premium
Glowing orange candlestick and line chart set against a dark grid background, symbolizing dynamic stock market trading, investment analytics, financial growth, trend forecasting, and technological mar
Digital Financial Data Display Over Server Background
Futuristic Digital Financial Graphs with Energy Icon
Abstract Financial Graphs with Rising Trends and Positive Indicators
Analyzing Financial Graphs with Real-Time Data Trends
Premium
Stock market graph on the screen. Investing and concept gain and profits with faded candlestick charts. Candle stick graph chart. Stock market chart, graph on blue background.
Data Processing Visualization on Digital World Map Interface
Colombian Flag Merging with Stock Market Graphs Illustrating Economy
Financial Data Processing with Abstract Digital Interface Graphics
Digital Finance Analytics in Modern Office Environment
Premium
Green 3D globe floating on trading dashboard with trend lines, candlestick bars and numeric data. Technology, finance, data visualization, digital, analytics, innovation, corporate
Financial Market Trends with Ukraine Flag Symbolism in Background
Dynamic Financial Data and Arrows with Technology Interface
Global Financial Data Overlaying Animated World Map
Global Financial Data on Virtual Screen Displaying Stock Market Trends
Premium
Showing chart with candlestick bars, line graph, labels on screen, hex grid overlay, diagonal bars. Technology, finance, analytics, data, dashboard, visualization, digital
Financial Market Data Visualization with Global Chart Overlay
Financial Data Visualization with Dynamic Graphical Analysis
Financial Data Processing with Molecular Overlay in a Digital Interface
Digital Data Analysis on World Map Grid with Global Connectivity
Premium
Displaying digital chart on trading desk, with candlestick bars, trend lines and numeric data. Finance, technology, analytics, data visualization, investment, stock market, dashboard
Futuristic Digital Analytics with Network Sphere and Candlestick Graphs
Market dashboard visualizing neon candlesticks, histogram bars and HUD rings for trading
Digital Financial Graph with Dynamic Trading Analysis
Abstract Financial Data Visualization in Digital Interface
Digital Data Processing Overlap with Financial Interfaces
Digital Financial Data Analytics Wand Big Affect SEO Tools Commercial
Premium
Overlaying financial data over smoggy city skyline, featuring graphs, candlestick bars and tickers. Data visualization, urban landscape, market analysis, analytical, digital, technology, finance
Global Data Processing with Financial Charts and World Map
Dynamic Financial Graph on Digital Background
Financial Data Processing with Global Business Analytics
Abstract Financial Data Analysis with Digital Figures
Premium
Businessman and businesswoman in formal wear working together to optimize trading strategy at corporate finance fund. Forex chart hologram over office background with panoramic windows
Security Hologram Over Digital Stock Market Analysis
Dynamic Financial Graphs Illustrating Market Trends and Data
Dynamic Stock Market Data Analysis on Blue Grid Background
Financial Data Processing Over Digital Cityscape
Premium
Overlaying glass skyscraper facades with financial data in city skyline, featuring candlestick bars. Urban, corporate, modern, reflective, digital, data, high-rise
Global Financial Data Overlay on Digital World Map
Digital Interface with Global Business Data Visualization
Global Financial Markets with Digital Interconnected Data
Global Financial Data Analysis with Digital World Map
Premium
Resting golf ball by red flagstick on putting green, showing candlestick bars, graphs, numeric data. Sport, finance, analytics, investment, market, strategic, outdoor
Digital Financial Data Visualization on World Map
Secure Data Analytics with Financial Graphs and Padlock Over Ukraine Flag
Abstract Financial Data with World Map Background
Global Financial Data Displayed with Digital Earth
Premium
Displaying candlestick chart and currency symbols on trading platform, with grid lines, green bars. Financial, technology, analytics, investment, interface, digital, data
Global Finance and Data Processing with Digital Globe Overlay
Innovative Data Analysis over DNA Strand
Digital Financial Chart with Binary Code Over Stock Market Data
Dynamic Financial Data Visualization with 3D Graphs and Candlesticks
Premium
Displaying dog wearing collar and looking upward in room, with trading candlestick chart overlay. Canine, pet, domestic, business, financial, digital, analytic
Candlestick and line market chart visualizing stock performance with percentage gain labels