1. Home > 
  2. Stock Photos > 
  3. Digital Trading Screen with Interactive Social Engagement Elements

Digital Trading Screen with Interactive Social Engagement Elements Image

Digital Trading Screen with Interactive Social Engagement Elements

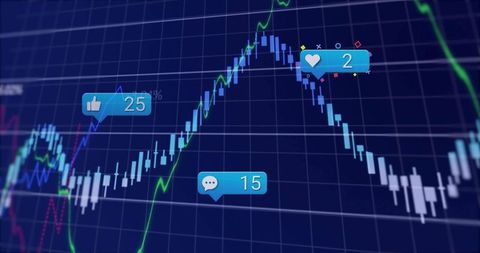
Visual representation of financial data and trading candlestick charts when combined with social media interaction elements. Appealing for content focused on modern finance, technology advancements in trading, or finance tech integration presentations. Useful for illustrating interplay between digital data analysis and real-time social engagement in trading contexts.

Powered by Adobe logo
Dynamic digital financial graph with glowing purple and blue trend lines on dark background displaying market analytics data for investment technology - Powered by AdobeFocused black woman wearing glasses concentrating on complex data and code displayed on a computer screen - Powered by AdobeA holographic globe with analytics panels hovering over a hand representing business intelligence and informed decisions, conveying the concept of data driven strategy forecasting  - Powered by AdobeBusinessman using computer mouse and keyboard to analyze financial data, market growth, and investment charts on a transparent interface. - Powered by AdobeAI finance business data analysis digital technology investment trading market stock, financial analyst using advanced holographic interface for global market insight, smart investment strategy - Powered by Adobe

Credit Photo

If you would like to credit the Photo, here are some ways you can do so

Free (free of charge)

Free for personal and commercial use.

Author: Awesome Content

Similar Free Stock Images

Dynamic Financial Data Analytics and Stock Market Trends
Premium
Global Market Trends and Financial Data Visualization Merging with Urban Smart City Landscape.
Stock Market Trends Visualized Against Urban Construction
Dynamic Stock Market Analysis with Blue Graphs and Percentages
Innovative Data Analysis over DNA Strand
Financial Graphs with Social Media Analytics on Digital Chart
Dynamic Financial Graphs and Data Analysis Interface
Digital Interface and Stock Market Analysis in Urban Cityscape
Digital Financial Data Analytics on Modern Display
Dynamic Stock Market Graph Showing Investment Trends
Dynamic Financial Graphs Illustrating Market Trends and Data
Dynamic Financial Data Overlaying Urban Cityscape
Premium
AI-powered data analytics dashboard displaying market trends and insights.
Premium
Confident businessman in front of stock market screens Generative AI image
Financial Market Trends with Ukraine Flag Symbolism in Background
Digital Financial Data Display with Graphs and Statistics
Financial Data Trends on Stock Market Graph
Global Financial Data Analysis on Grid Background
Premium
Analyzing stock market data  insights into financial technology innovations and trends
Dynamic Financial Data Display Over Global Stock Market
Financial Data Visualization with Charts and Graphs Showing Market Trends
Analytical Trading Dashboard with Rising Candlestick Charts
Inflation Analytics: Graphic Representation of Stock Market Trends
Premium
Digital financial chart with glowing bars and market data visualization in blue and orange neon colors. Business analytics dashboard. Technology background for finance presentation
Premium
Abstract financial data chart with glowing digital lines, futuristic stock market analytics background, big data visualization, blockchain economy, business growth and technology concept
Stock Market Data Analysis with Digital Security Element
Dynamic Financial Data Analysis with Market Charts
Subscriber Analytics Dashboard with Candlestick Charts and Line Graphs Showing 477,785 Subscribers
Abstract Financial Data Over Cityscape Imagery
Premium
City skyline with vibrant digital data visualization at night showcasing financial trends and market analysis
Financial Market Love: Red Hearts and Economic Graph Integration
Dynamic Stock Market Graphs Showing Fluctuating Trends
Dynamic Financial Data Chart Display with Graphical Analysis
Premium
Hand interacting with digital chart showing financial crisis warning symbols and negative trend lines on dark background, representing risk management concept.
Digital Financial Data with Arrows Indicating Growth
Stock Market Graph Reflecting Financial Trends and Analysis
Global Financial Market Trends on Digital Screen
Premium

Dynamic blue and green digital stock market graph with bar charts and lines on a dark background, representing financial data analysis, investment trends, business growth, and global economy fluctuat
Premium
Transparent or png stock market investment trading graph growth.Trade business analytics graph and financial chart.
Neon Analytics Dashboard Showing Rising Blue Trend Line, Red Volatility, Dotted Bars
Glowing Stock Market Financial Chart Data Overlay
Data Analytics with Dynamic Global Market Trends on Screen
Financial Data Analysis with Stock Market Graphs
Dynamic Digital Market Analysis with Holographic Data
Abstract Financial Market Data Analysis Visualization
Dynamic Financial Data Analysis Charts with Green Digital Grid
Dynamic Stock Market Chart with Shoe Icons Overlay
Social Media Analytics Dashboard Showing Real-Time Likes Comments Followers on 3D Grid
Premium
2026 financial growth forecast with stock market data
Combining Renewable Energy with Dynamic Financial Data Visualization
Security Hologram Over Digital Stock Market Analysis
Futuristic Stock Market Concept with Social Media Integration
Dynamic Stock Market Candlestick Chart with Moving Averages and Percent Indicators
Premium
Mechanical eyes scanning fluctuating stock market, Robot program trading
Dynamic Financial Data Growth Chart Display
Dynamic Stock Market Graphs with Finance Data
Abstract Financial Data with Digitally Enhanced Graphs
Tech-Focused Financial Data Visualization with Rising Graphs
Financial Graphs Displayed Over Aerial City View
Financial Data Processing with Mathematical Formulae Interface
Futuristic Financial Data Visualization Over City
Dynamic Financial Data Visualization on Grid
Premium
A vibrant blue bar chart displays increasing financial data overlaid with a glowing yellow line graph showing a positive upward trend symbolizing economic progress and investment success
Financial Data Market Chart Analysis with Digital Overlay
Dynamic Forex Trading Graphs with Increasing Numbers
Abstract Financial Data Analysis and Stock Market Trends
Premium
Analyzing financial charts and data reports in modern office setting
Premium
Hand holding magnifying glass over glowing digital financial chart with data analysis and growth trends on dark background
Digital Analysis of Financial Data with Dynamic Graphs
Dynamic Financial Growth Graph on Blue Grid Background
Financial Graphs and Digital Data on Dark Background
Financial Data and Stock Market Trends Overlaying Cityscape
Premium
Data analyzing and stock market visualization with digital charts, financial dashboards, and performance metrics. Ideal for investment analysis, trading strategy, and economic forecasting.
Dynamic Financial Data Chart on Blue Background
Rising Stock Market Trend with Digital Data Analytics
Financial Data Charts and Graphs on Digital Interface
Digital Financial Data Visualization on Grid Display
Premium
Colorful business analytics chart representing financial growth and data analysis
Financial Data Processing Over Digital Cityscape
Illuminated Financial Data Chart Display on Dark Backdrop
Financial Data Information with Graphs and Charts for Stock Market Analysis
Dynamic Financial Chart with Blue and Purple Indicators
Premium
Dynamic financial analyst showcasing business growth with cutting edge technology and data visualization tools
Global Data Projection Showing Stock Market Trends with Digital Globe
Abstract Financial Data Graphics Illustrating Analysis
Dynamic Display of Financial Market Data on Advanced Grid
Financial Graph Overlay on Power Lines at Dusk
Financial Data Analysis Over Vibrant Cityscape Background
Dynamic Financial Graph Analyzing Market Trends
Abstract Financial Data Display with Analytical Graphs
Digital Financial Data Analysis with Chart and Markers
Dynamic Analysis of Stock Market Trends and Patterns
Financial Data Analysis with Growth Trend Arrows on Digital Interface
Financial Graphs with Cityscape Background Reflecting Market Trends
Global Financial Data Interface with Rotating Globe Overlay
Financial Data Graph with Digital Elements and Growth Indicators
Dynamic Global Financial Analytics with Rising Graph Visualization
Stock Market Graph and Data Analysis
Market dashboard displaying candlestick chart, volume profile and moving averages
Candlestick chart showing sharp peak and decline with moving averages on trading dashboard
Dynamic Financial Data Processing Showing Stock Market Interface
Financial Data Visualization on Digital Grid
Premium
A dynamic business meeting showcasing collaboration and partnership through data analytics visuals, emphasizing teamwork and strategic growth in a professional environment. Amity
Dynamic Stock Market Graphs and Financial Data Visualization
Rising Graphs and Interactive Financial Data Analytics Background
Premium
Glowing orange arrow graph shows upward trend on abstract digital network background. Data analytics chart displays positive growth in cyber space. Futuristic technology concept illustration.
Global Networking and Data Visualization Over Stormy Sky
Abstract Financial Graphs with Rising Trends and Positive Indicators
Financial Graphs Overlay on Cityscape Featuring Global Economy Theme
Financial Data Analysis with Growing Stock Trends
Premium
Hand pointing at a world map with stock market charts and data overlays indicating global financial activity
Digital Data Analytics Growth Trend with Graphs
Digital Financial Chart Showing Growth and Dynamic Indicators
Financial Market Chart on Digital Screen Showing Growing Trends
Secure Data Analytics with Financial Graphs and Padlock Over Ukraine Flag
Premium
Business Growth Chart Analysis on Digital Tablet.
Dynamic Charts and Spreadsheet Overlay on Desk for Financial Analysis
Holographic Battery Icon Over Stock Market Trading Board
Dynamic Stock Market and Financial Data Analysis Concept
Social Media Alerts Catalysts of Financial Analytics Trends
Premium
Man presenting financial data on a large screen
Premium
Analysis of stock market trends through binoculars at night for detailed observation of financial data
Premium
Businessman interacting with digital forex and stock market chart interface showing buy and sell decisions with futuristic holographic data overlay.
Financial Data Visualization with Increasing Graph Trend
Dynamic Stock Market Ticker and Graph Analysis
Explore More Free Stock Images