
- Home >
- Stock Photos >
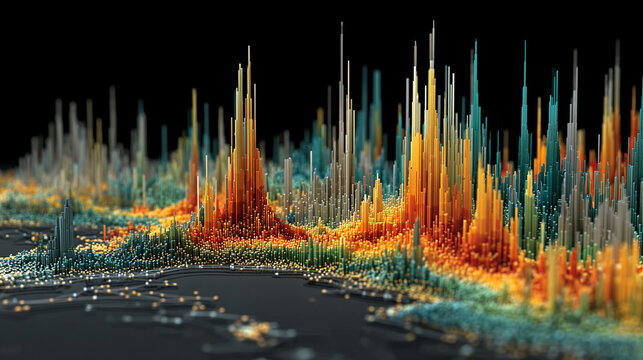
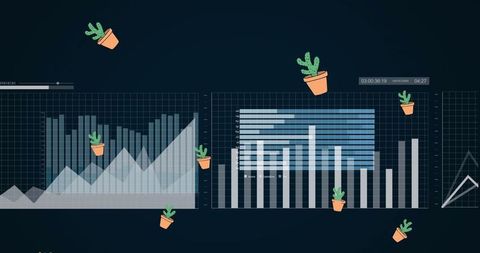
- Digital Trend Analysis on Interactive Virtual Dashboard
Digital Trend Analysis on Interactive Virtual Dashboard Image

Presents a visual depiction of data analytics on a modern interactive dashboard, showing a trend line with colorful vertical bars across a digital display. Icons representing various services and functions adorn the background in a hexagonal pattern, symbolizing innovation and technology in data handling. Useful for illustrating modern business intelligence, technology reports, analytics tools, digital interfaces, and educational materials about data visualization techniques and trends.
Powered by 


downloads
Tags:
More
Credit Photo
If you would like to credit the Photo, here are some ways you can do so
Text Link
photo Link
<span class="text-link">
<span>
<a target="_blank" href=https://pikwizard.com/photo/digital-trend-analysis-on-interactive-virtual-dashboard/def957c56b52918cc5d981888b2b5ce0/>PikWizard</a>
</span>
</span>
<span class="image-link">
<span
style="margin: 0 0 20px 0; display: inline-block; vertical-align: middle; width: 100%;"
>
<a
target="_blank"
href="https://pikwizard.com/photo/digital-trend-analysis-on-interactive-virtual-dashboard/def957c56b52918cc5d981888b2b5ce0/"
style="text-decoration: none; font-size: 10px; margin: 0;"
>
<img src="https://pikwizard.com/pw/medium/def957c56b52918cc5d981888b2b5ce0.jpg" style="margin: 0; width: 100%;" alt="" />
<p style="font-size: 12px; margin: 0;">PikWizard</p>
</a>
</span>
</span>
Free (free of charge)
Free for personal and commercial use.
Author: Awesome Content
Similar Free Stock Images

Premium


Premium


Premium


Premium


Premium

Premium

Premium


Premium

Premium


Premium


Premium


Premium


Premium


Premium


Premium


Premium


Premium


Premium


Premium

Premium

Premium


Premium


Premium


Premium

Premium


Explore More Free Stock Images