- Home >
- Stock Photos >
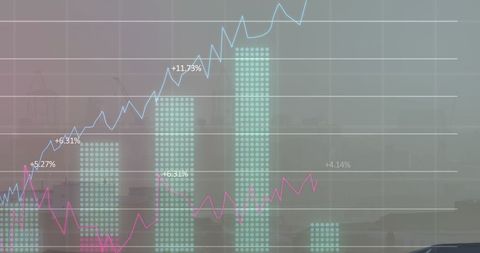
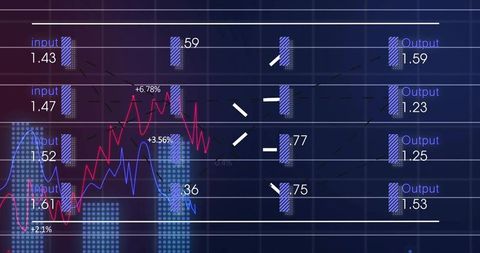
- Digital Visualization Financial Data Growth Progressive Graph
Digital Visualization Financial Data Growth Progressive Graph Image

Stylized graph data visualizes increasing financial trends showing percentage gains. Perfect for presentations, educational materials, or illustrating themes of business growth and data analysis in articles or blogs. Useful for designing covers related to global finance, economics, and technology.

downloads
Tags:
More
Credit Photo
If you would like to credit the Photo, here are some ways you can do so
Text Link
photo Link
<span class="text-link">
<span>
<a target="_blank" href=https://pikwizard.com/photo/digital-visualization-financial-data-growth-progressive-graph/a8976e9efea0f5cfcb213ea0196323d8/>PikWizard</a>
</span>
</span>
<span class="image-link">
<span
style="margin: 0 0 20px 0; display: inline-block; vertical-align: middle; width: 100%;"
>
<a
target="_blank"
href="https://pikwizard.com/photo/digital-visualization-financial-data-growth-progressive-graph/a8976e9efea0f5cfcb213ea0196323d8/"
style="text-decoration: none; font-size: 10px; margin: 0;"
>
<img src="https://pikwizard.com/pw/medium/a8976e9efea0f5cfcb213ea0196323d8.jpg" style="margin: 0; width: 100%;" alt="" />
<p style="font-size: 12px; margin: 0;">PikWizard</p>
</a>
</span>
</span>
Free (free of charge)
Free for personal and commercial use.
Author: Authentic Images