- Home >
- Stock Photos >
- Digital Visualization of COVID-19 Pandemic Data Analysis
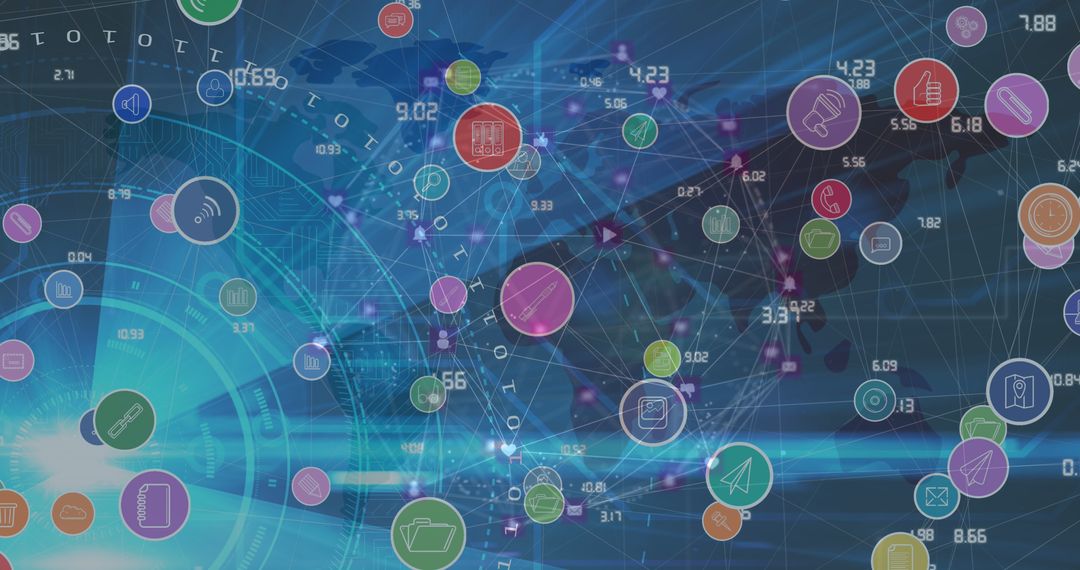
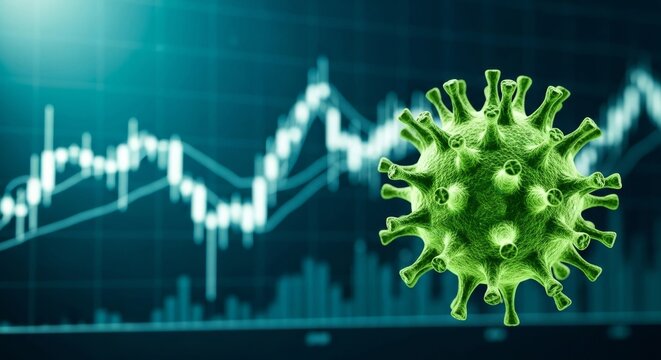
Digital Visualization of COVID-19 Pandemic Data Analysis Image

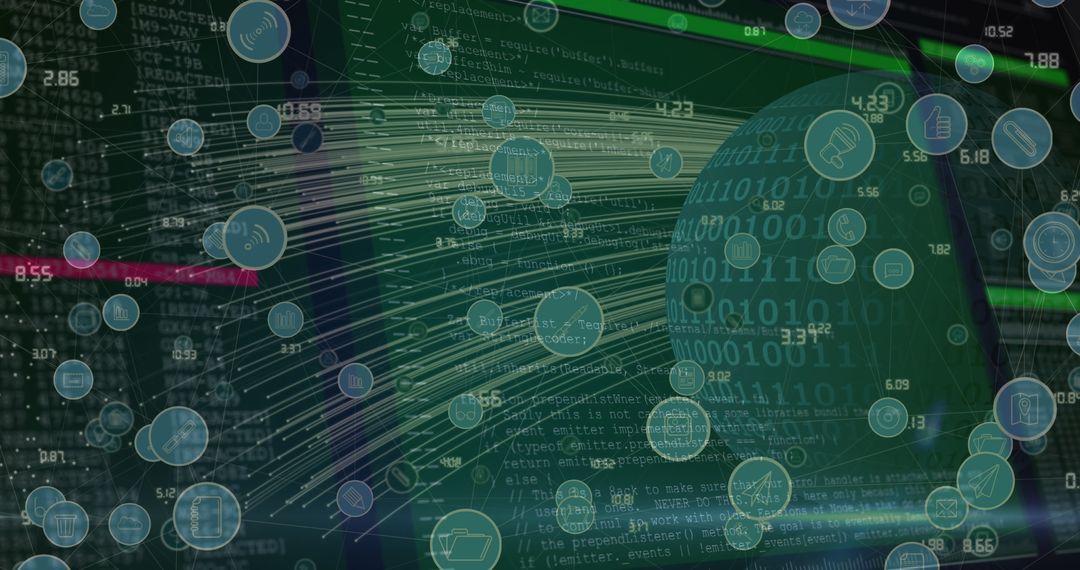
This image captures the intersection of digital data and the COVID-19 pandemic through sophisticated graphing and illustration of virus cells. It can be used to depict global health analytics, crisis data conveyance, and is perfect for articles, presentations, or reports focused on understanding and communicating the pandemic's global statistical impact. Suitable for websites and educational materials exploring real-time analytics or emerging technological integration in health sectors.
Powered by 


2
downloads
downloads
Tags:
More
Credit Photo
If you would like to credit the Photo, here are some ways you can do so
Text Link
photo Link
<span class="text-link">
<span>
<a target="_blank" href=https://pikwizard.com/photo/digital-visualization-of-covid-19-pandemic-data-analysis/707a89c8b37d17649d73d88ef7623d1d/>PikWizard</a>
</span>
</span>
<span class="image-link">
<span
style="margin: 0 0 20px 0; display: inline-block; vertical-align: middle; width: 100%;"
>
<a
target="_blank"
href="https://pikwizard.com/photo/digital-visualization-of-covid-19-pandemic-data-analysis/707a89c8b37d17649d73d88ef7623d1d/"
style="text-decoration: none; font-size: 10px; margin: 0;"
>
<img src="https://pikwizard.com/pw/medium/707a89c8b37d17649d73d88ef7623d1d.jpg" style="margin: 0; width: 100%;" alt="" />
<p style="font-size: 12px; margin: 0;">PikWizard</p>
</a>
</span>
</span>
Free (free of charge)
Free for personal and commercial use.
Author: People Creations
Similar Free Stock Images

Premium


Premium


Premium


Premium


Premium


Premium


Premium


Premium


Premium


Premium


Premium


Premium


Premium


Premium


Premium


Premium


Premium


Premium


Premium


Premium


Premium


Premium


Premium


Premium