
- Home >
- Stock Photos >
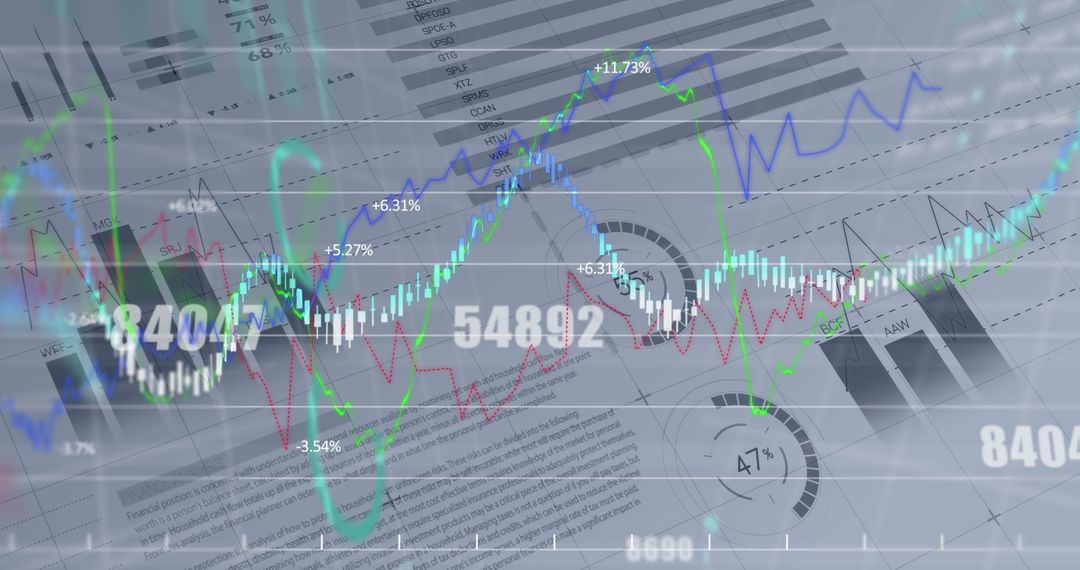
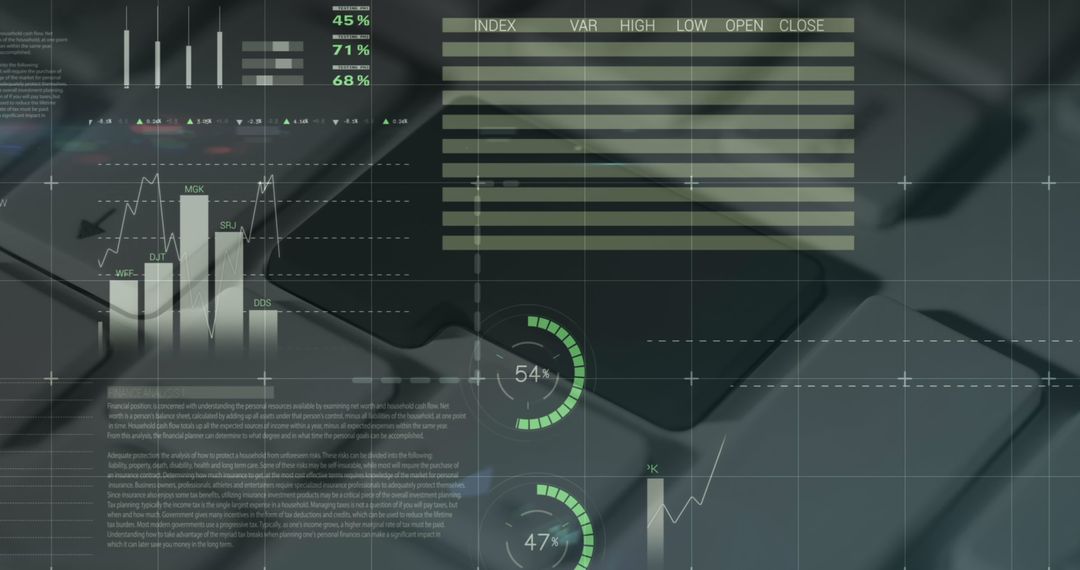
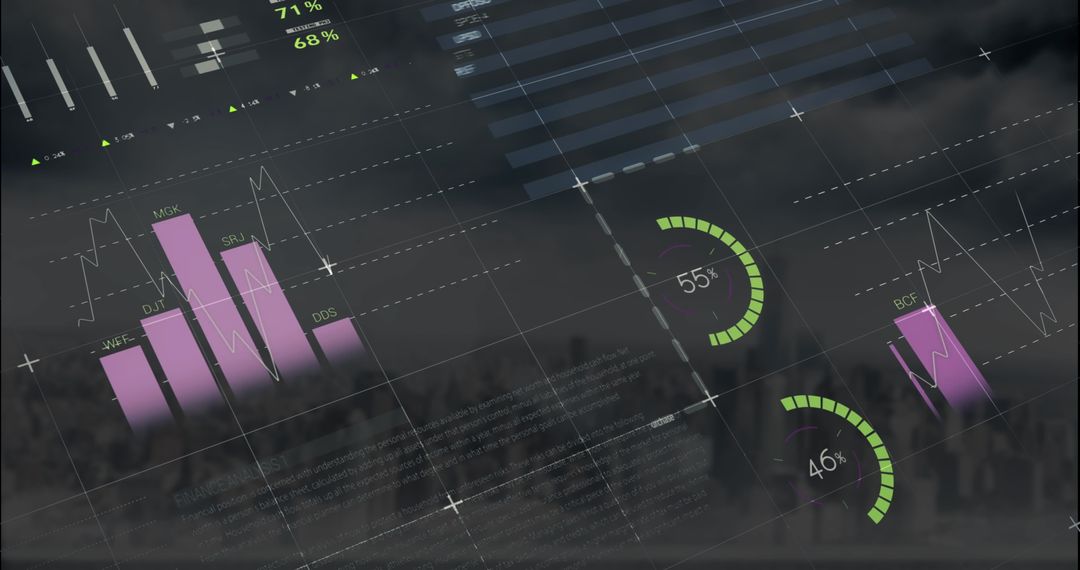
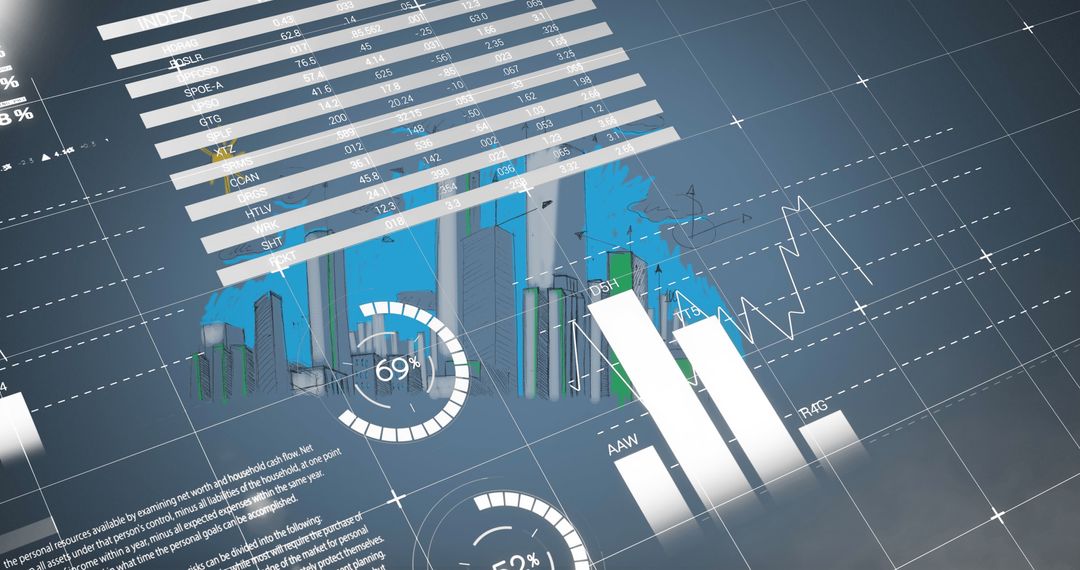
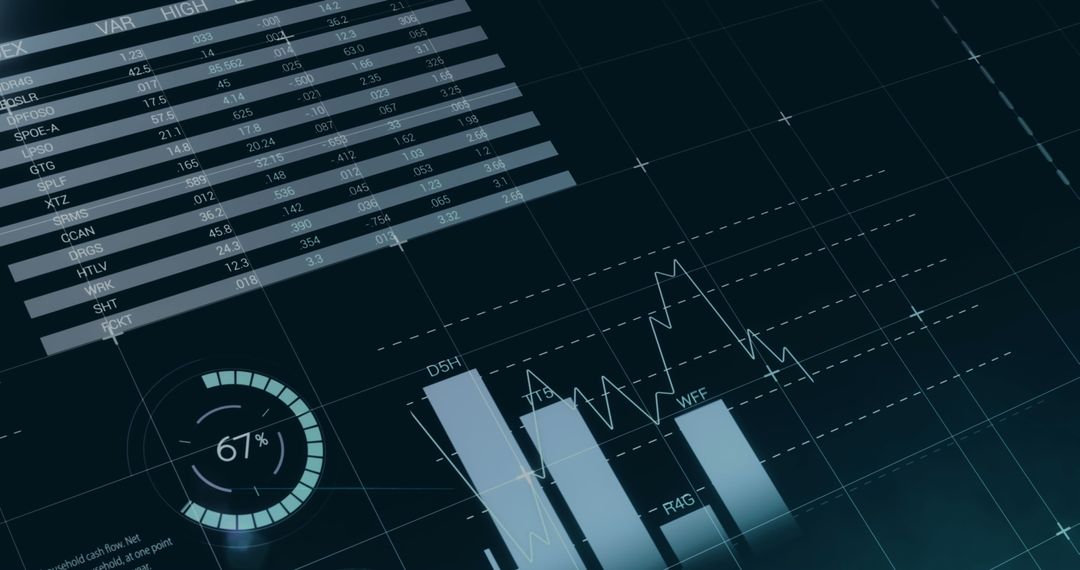
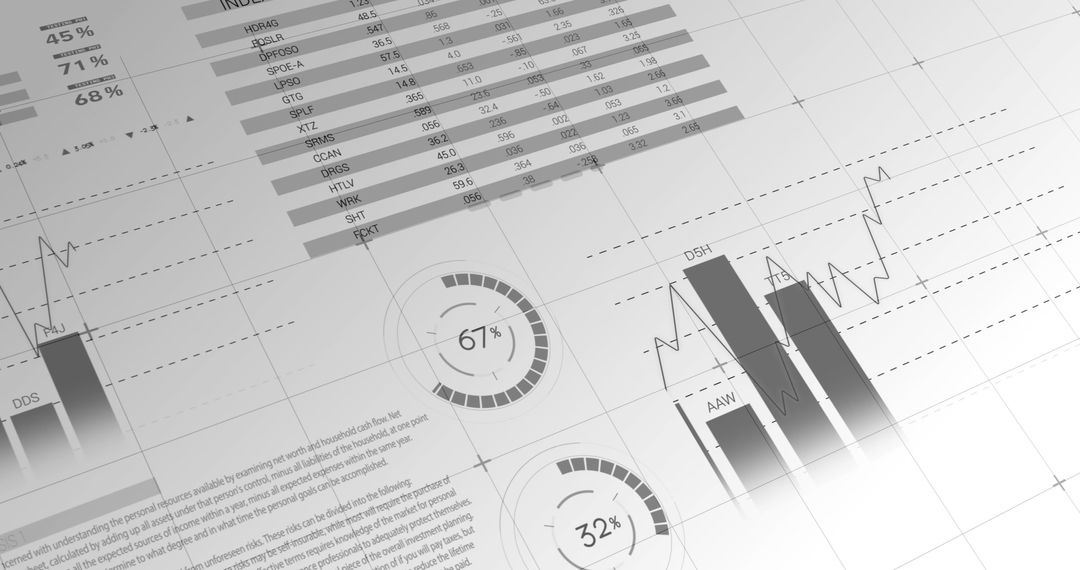
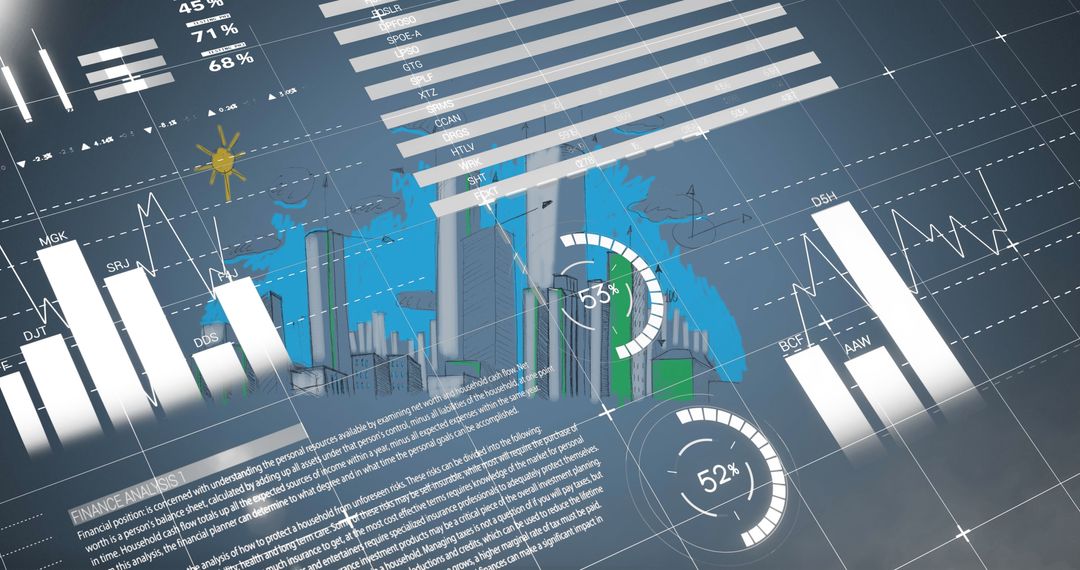
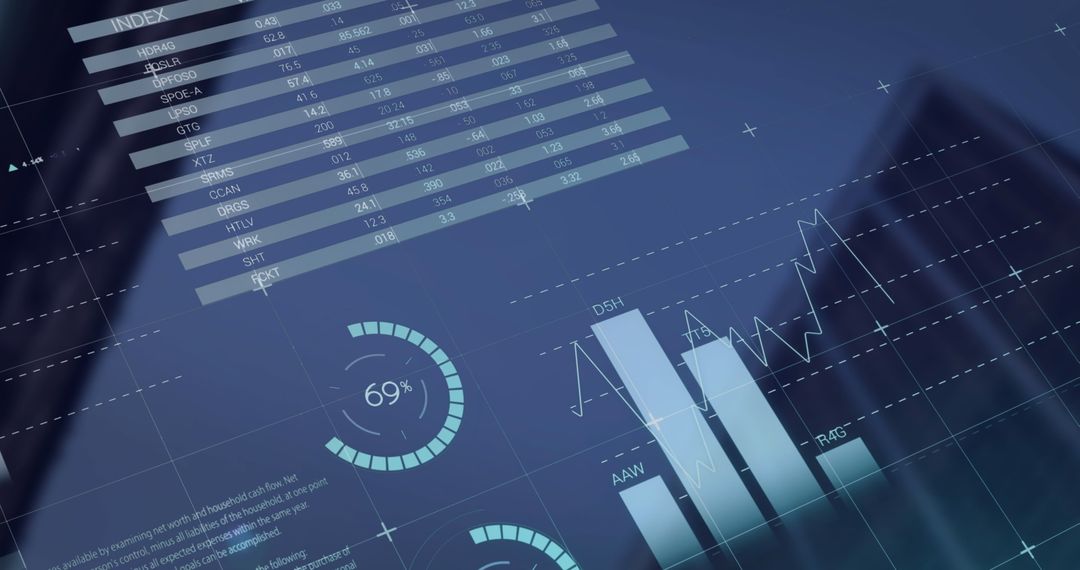
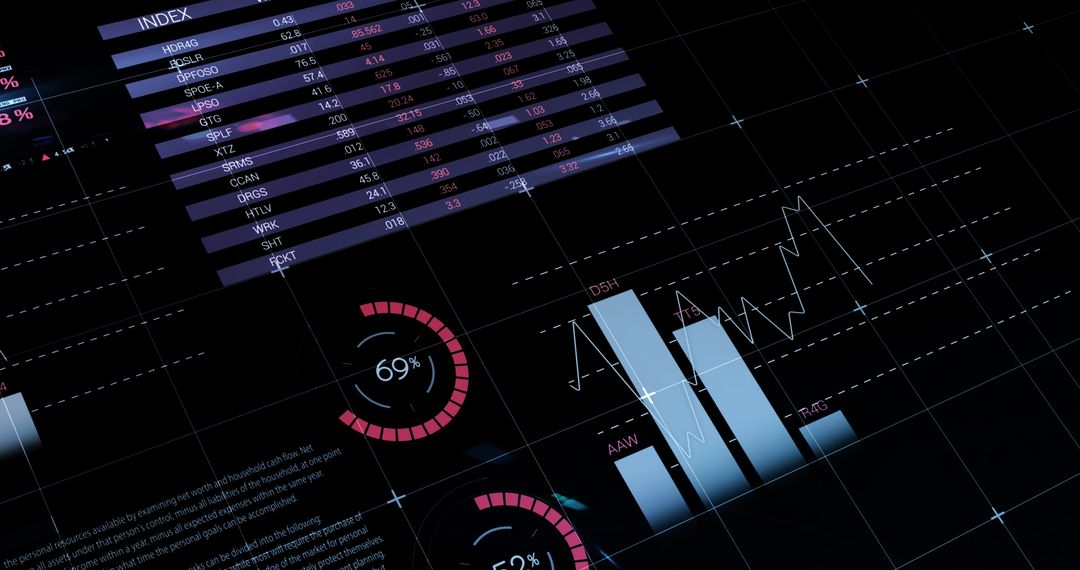
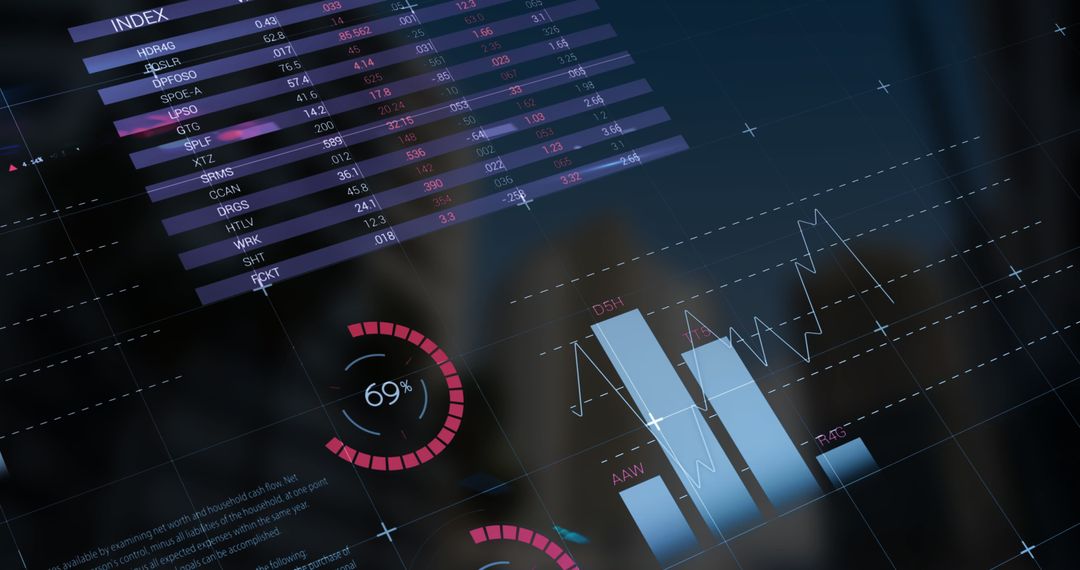
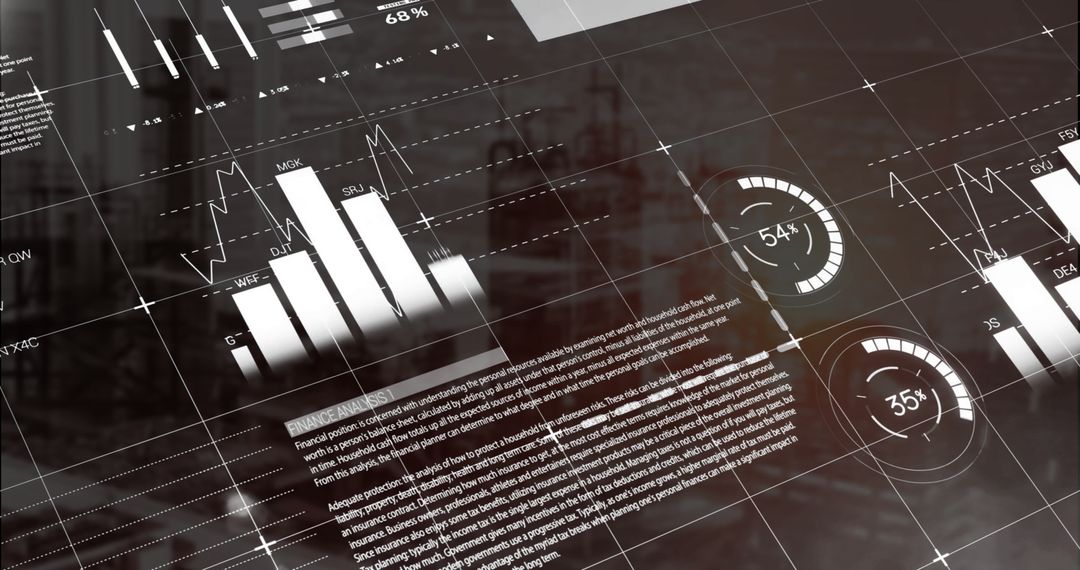
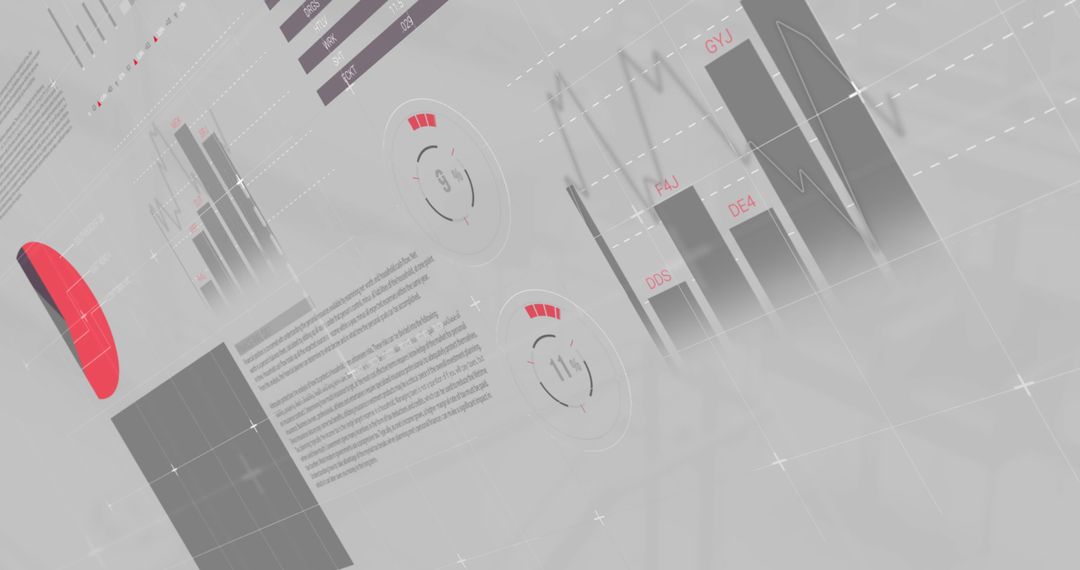
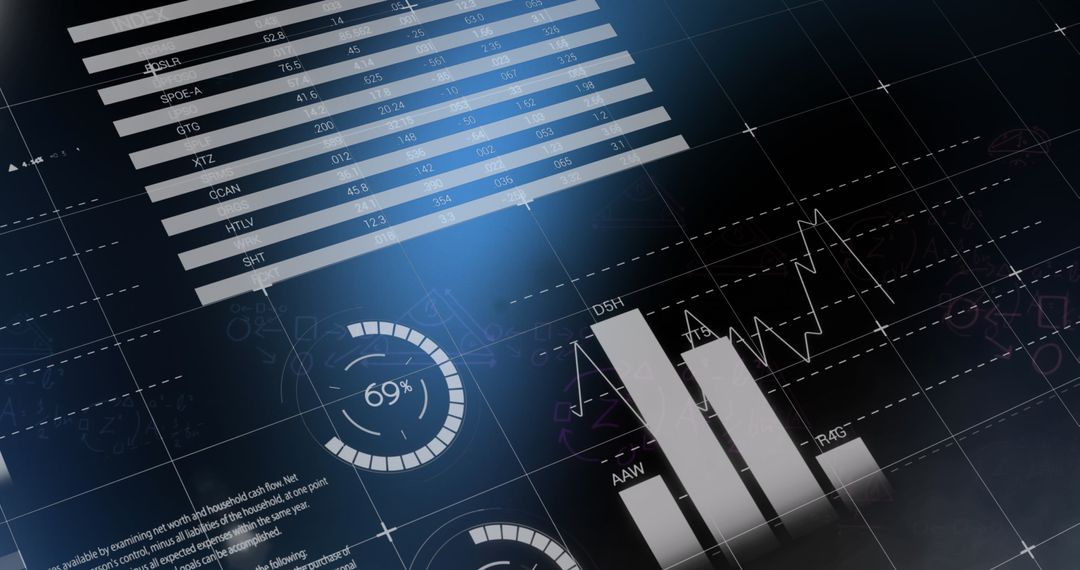
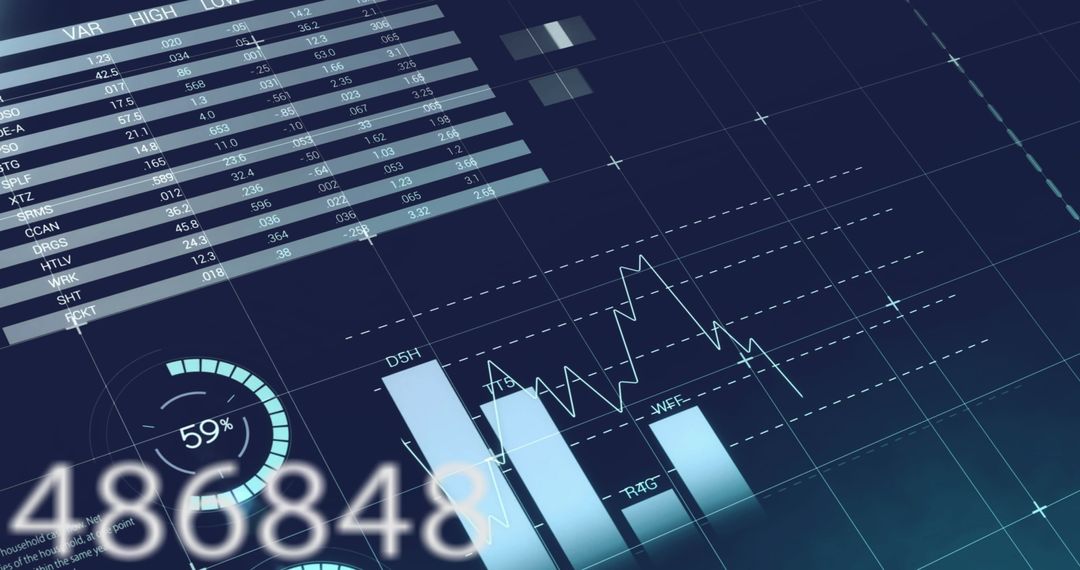
- Digital Visualization of Financial Data and Analytics
Digital Visualization of Financial Data and Analytics Image

This visual represents abstract digital financial analytics with charts and graphs. Useful for technology blogs, articles on wealth management, or presentations about investment and business strategy. Effective for conveying ideas related to economic analysis and financial prediction models.
Powered by  - Get 15% off with code: PIKWIZARD15


24
downloads
downloads
Tags:
More
Credit Photo
If you would like to credit the Photo, here are some ways you can do so
Text Link
photo Link
<span class="text-link">
<span>
<a target="_blank" href=https://pikwizard.com/photo/digital-visualization-of-financial-data-and-analytics/6210afdc18c8ccb75e557df915cda74c/>PikWizard</a>
</span>
</span>
<span class="image-link">
<span
style="margin: 0 0 20px 0; display: inline-block; vertical-align: middle; width: 100%;"
>
<a
target="_blank"
href="https://pikwizard.com/photo/digital-visualization-of-financial-data-and-analytics/6210afdc18c8ccb75e557df915cda74c/"
style="text-decoration: none; font-size: 10px; margin: 0;"
>
<img src="https://pikwizard.com/pw/medium/6210afdc18c8ccb75e557df915cda74c.jpg" style="margin: 0; width: 100%;" alt="" />
<p style="font-size: 12px; margin: 0;">PikWizard</p>
</a>
</span>
</span>
Free (free of charge)
Free for personal and commercial use.
Author: People Creations
Similar Free Stock Images

Premium


Premium


Premium


Premium


Premium


Premium


Premium


Premium

Premium

Premium


Premium


Premium


Premium


Premium


Premium


Premium


Premium


Premium


Premium


Premium


Premium


Premium


Premium


Premium

