
- Home >
- Stock Photos >
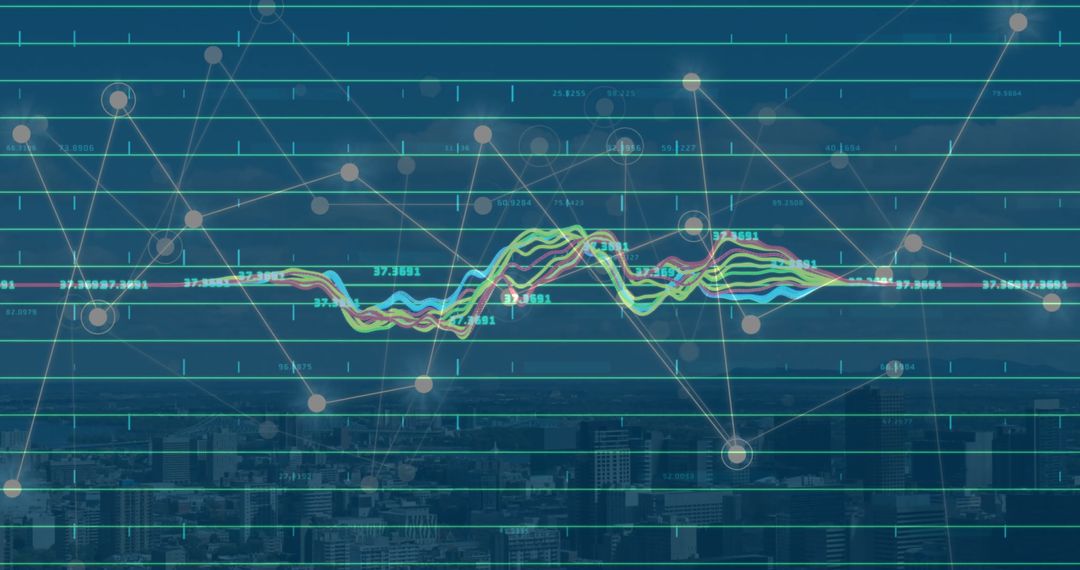
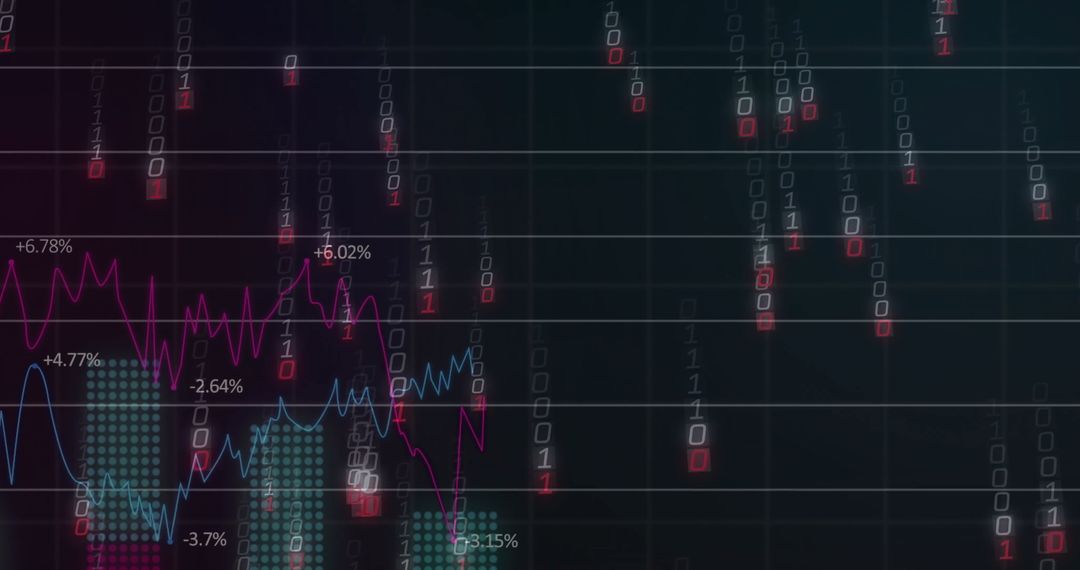
- Digital Visualization of Financial Data and Network Connections
Digital Visualization of Financial Data and Network Connections Image

Complex intertwining between financial data represented by colorful graphs overlaying a network connection background. Suitable for illustrating concepts of modern finance, data analysis, and technology infrastructure. Useful for websites, presentations, or articles focused on finance sector digital transformation and data analytics tools.
Powered by  - Get 15% off with code: PIKWIZARD15


2
downloads
downloads
Tags:
More
Credit Photo
If you would like to credit the Photo, here are some ways you can do so
Text Link
photo Link
<span class="text-link">
<span>
<a target="_blank" href=https://pikwizard.com/photo/digital-visualization-of-financial-data-and-network-connections/067e5edffc79b2bdf3f9acfcbd59a3d7/>PikWizard</a>
</span>
</span>
<span class="image-link">
<span
style="margin: 0 0 20px 0; display: inline-block; vertical-align: middle; width: 100%;"
>
<a
target="_blank"
href="https://pikwizard.com/photo/digital-visualization-of-financial-data-and-network-connections/067e5edffc79b2bdf3f9acfcbd59a3d7/"
style="text-decoration: none; font-size: 10px; margin: 0;"
>
<img src="https://pikwizard.com/pw/medium/067e5edffc79b2bdf3f9acfcbd59a3d7.jpg" style="margin: 0; width: 100%;" alt="" />
<p style="font-size: 12px; margin: 0;">PikWizard</p>
</a>
</span>
</span>
Free (free of charge)
Free for personal and commercial use.
Author: Creative Art
Similar Free Stock Images

Premium


Premium


Premium


Premium


Premium


Premium


Premium


Premium


Premium


Premium


Premium


Premium


Premium


Premium


Premium


Premium


Premium


Premium


Premium


Premium


Premium


Premium


Premium


Premium

