- Home >
- Stock Photos >
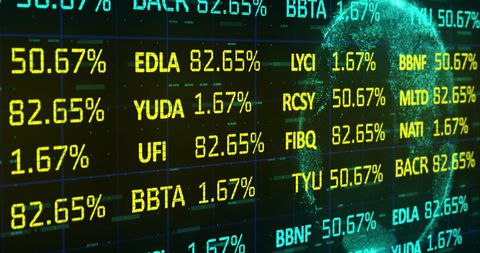
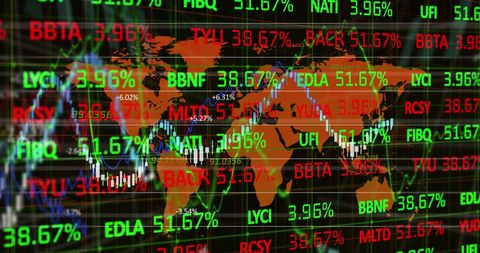
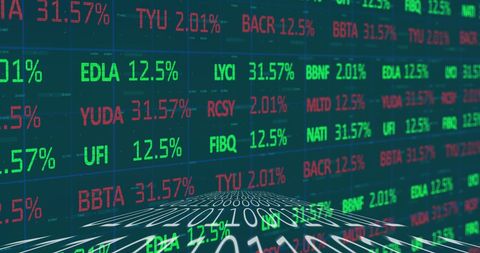
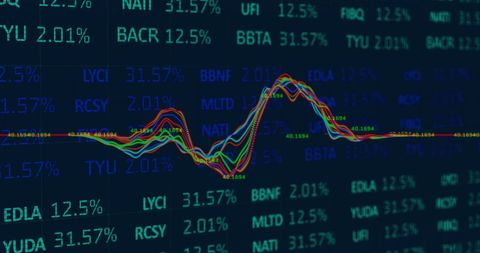
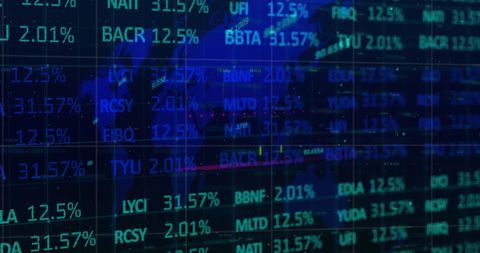
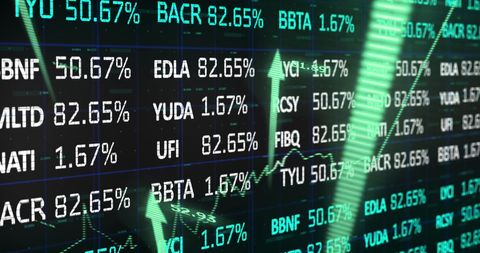
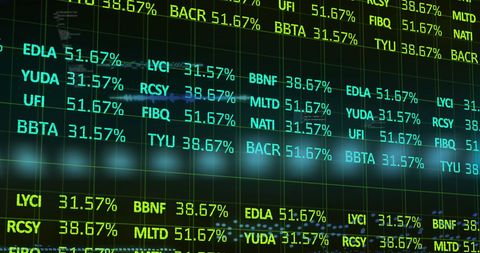
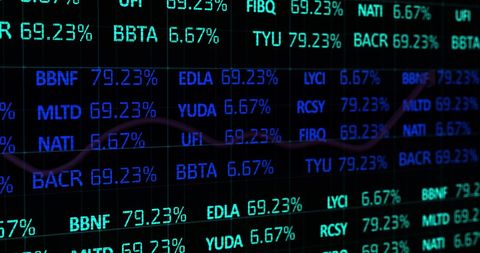
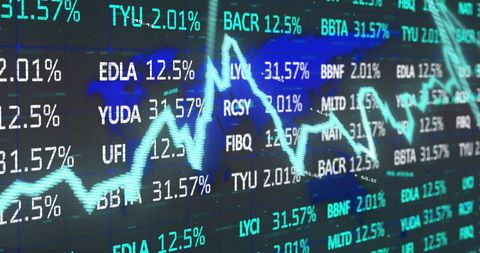
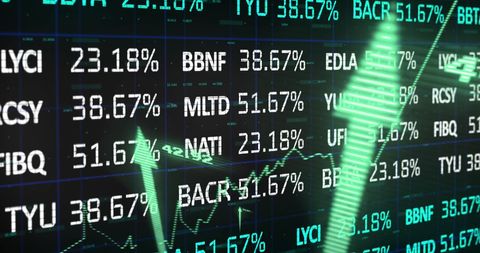
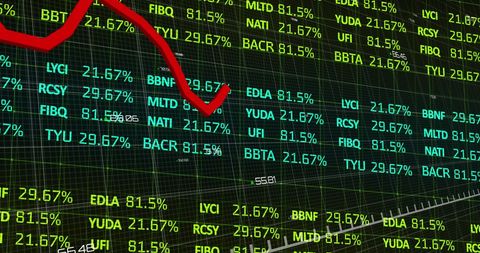
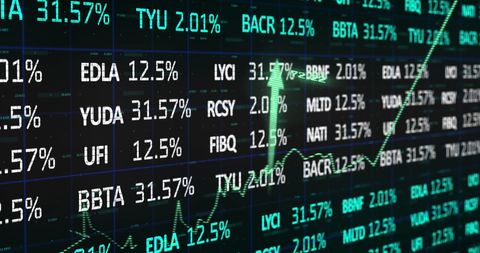
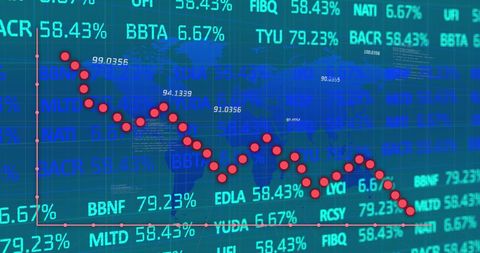
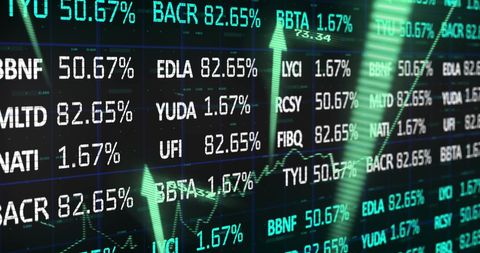
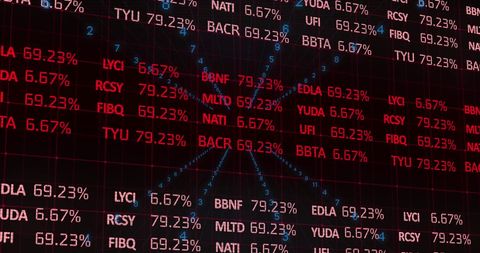
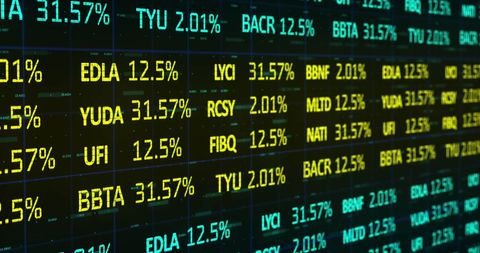
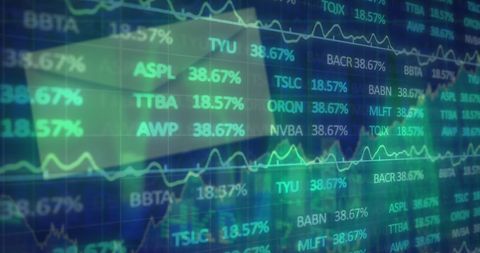
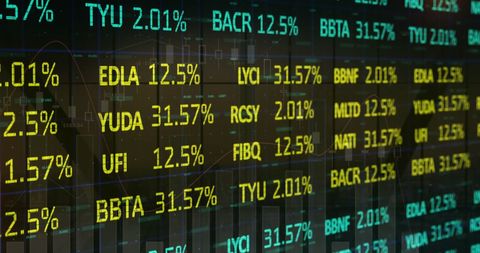
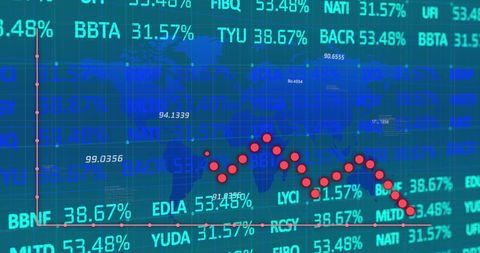
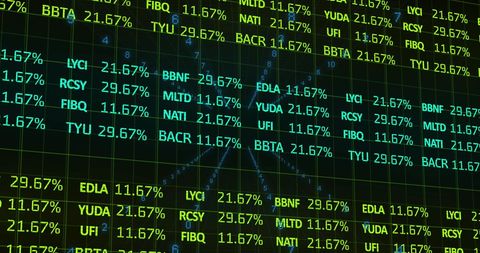
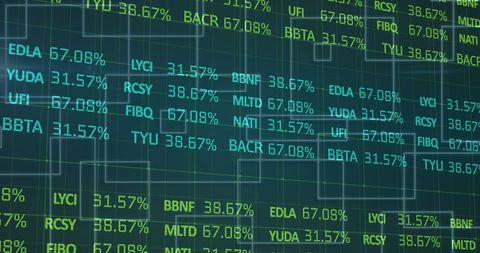
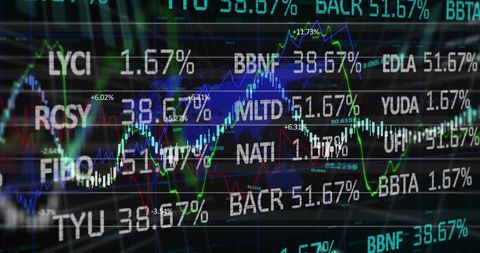
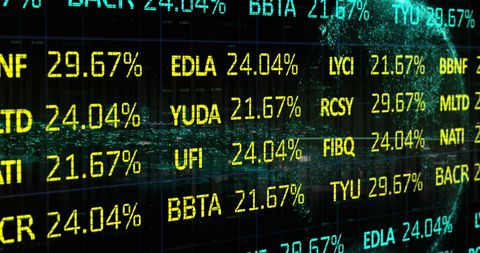
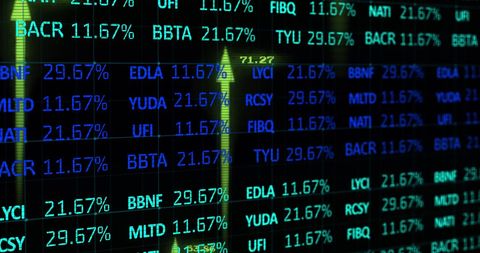
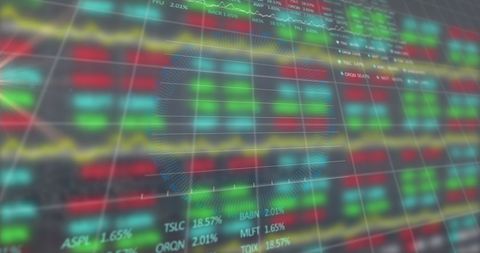
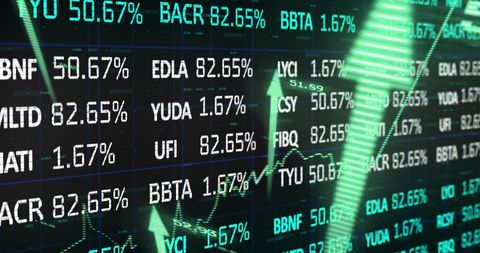
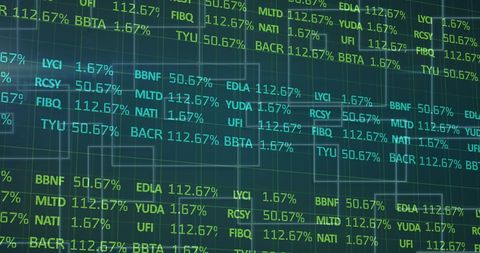
- Digital Visualization of Global Financial Data Trends
Digital Visualization of Global Financial Data Trends Image
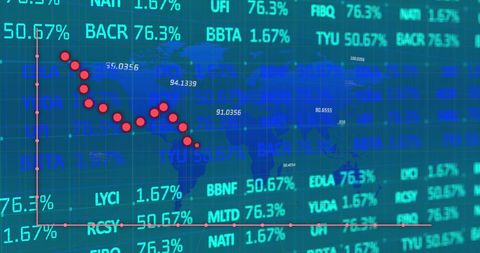
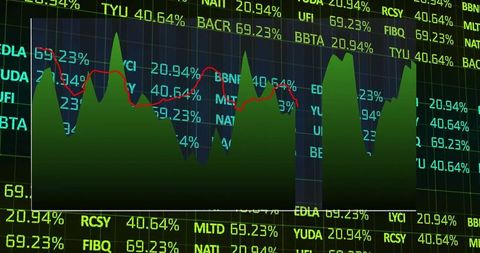
Visualization depicting financial charts and data overlay on a green background, representing global finance and technology. Shows fluctuating statistics ideal for illustrating concepts of economic trends, market forecasting, financial analysis, or investment strategies in articles, presentations, and educational materials.
Powered by 


2
downloads
downloads
Tags:
More
Credit Photo
If you would like to credit the Photo, here are some ways you can do so
Text Link
photo Link
<span class="text-link">
<span>
<a target="_blank" href=https://pikwizard.com/photo/digital-visualization-of-global-financial-data-trends/6e7a2b3a05ef0183cb1f26a5cea7347b/>PikWizard</a>
</span>
</span>
<span class="image-link">
<span
style="margin: 0 0 20px 0; display: inline-block; vertical-align: middle; width: 100%;"
>
<a
target="_blank"
href="https://pikwizard.com/photo/digital-visualization-of-global-financial-data-trends/6e7a2b3a05ef0183cb1f26a5cea7347b/"
style="text-decoration: none; font-size: 10px; margin: 0;"
>
<img src="https://pikwizard.com/pw/medium/6e7a2b3a05ef0183cb1f26a5cea7347b.jpg" style="margin: 0; width: 100%;" alt="" />
<p style="font-size: 12px; margin: 0;">PikWizard</p>
</a>
</span>
</span>
Free (free of charge)
Free for personal and commercial use.
Author: Creative Art
Similar Free Stock Images
Loading...
Premium


Premium


Premium


Premium


Premium


Premium


Premium


Premium

Premium


Premium


Premium


Premium


Premium


Premium


Premium


Premium


Premium


Premium


Premium


Premium

Premium


Premium


Premium


Premium


Premium