- Home >
- Stock Photos >
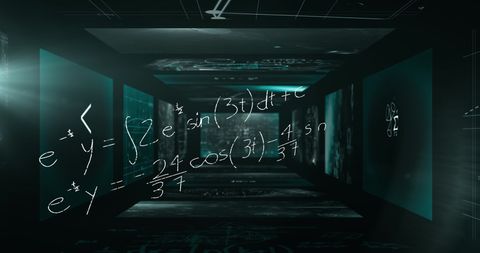
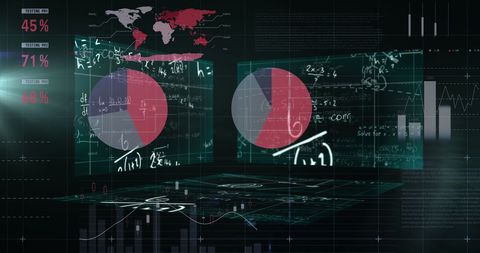
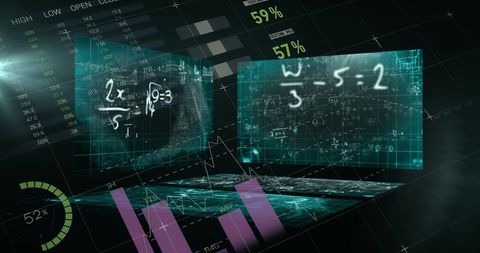
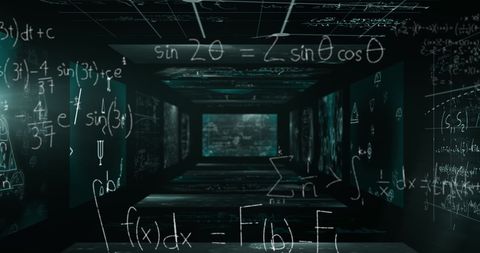
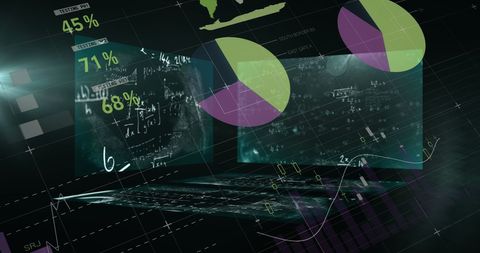
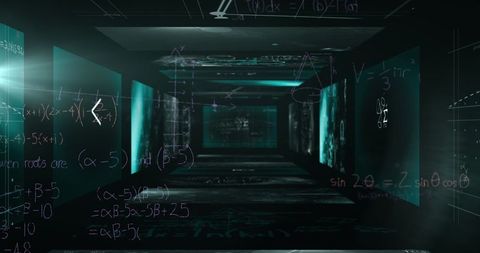
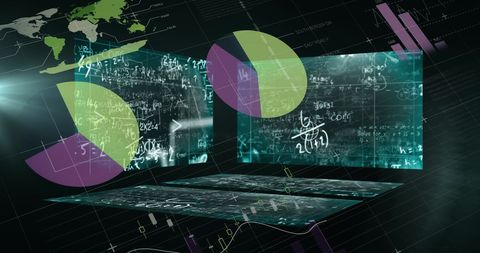
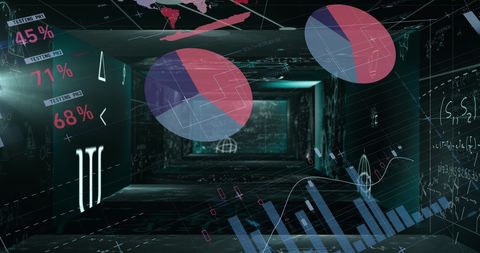
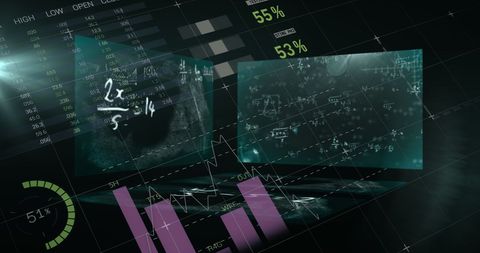
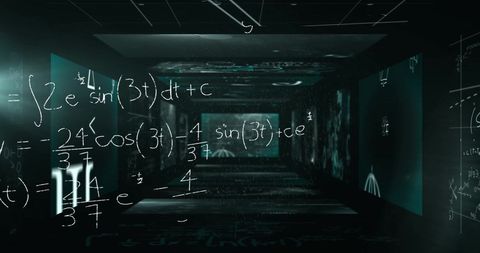
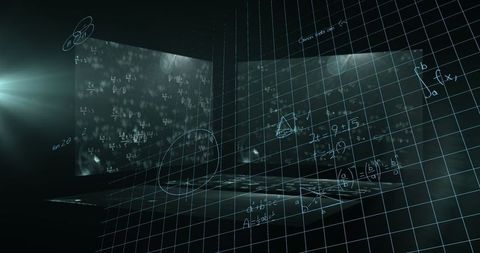
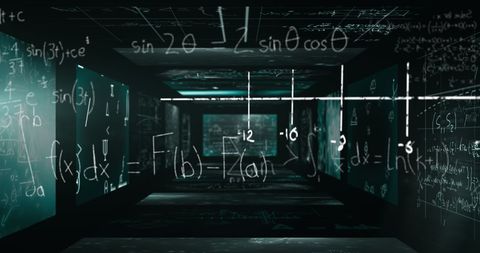
- Digital Visualization of Mathematical Equations with Statistical Graphs
Digital Visualization of Mathematical Equations with Statistical Graphs Image

Dynamic digital representation of mathematical formulas interwoven with statistical charts highlights technological integration in data analysis and scientific computations. Useful for tech industry publications, educational materials, or illustrations focusing on mathematics technologies and analytics.
Powered by  - Get 15% off with code: PIKWIZARD15


2
downloads
downloads
Tags:
More
Credit Photo
If you would like to credit the Photo, here are some ways you can do so
Text Link
photo Link
<span class="text-link">
<span>
<a target="_blank" href=https://pikwizard.com/photo/digital-visualization-of-mathematical-equations-with-statistical-graphs/d0b9245890f0c9475e058f77e1a99d3d/>PikWizard</a>
</span>
</span>
<span class="image-link">
<span
style="margin: 0 0 20px 0; display: inline-block; vertical-align: middle; width: 100%;"
>
<a
target="_blank"
href="https://pikwizard.com/photo/digital-visualization-of-mathematical-equations-with-statistical-graphs/d0b9245890f0c9475e058f77e1a99d3d/"
style="text-decoration: none; font-size: 10px; margin: 0;"
>
<img src="https://pikwizard.com/pw/medium/d0b9245890f0c9475e058f77e1a99d3d.jpg" style="margin: 0; width: 100%;" alt="" />
<p style="font-size: 12px; margin: 0;">PikWizard</p>
</a>
</span>
</span>
Free (free of charge)
Free for personal and commercial use.
Author: Creative Art