
- Home >
- Stock Photos >
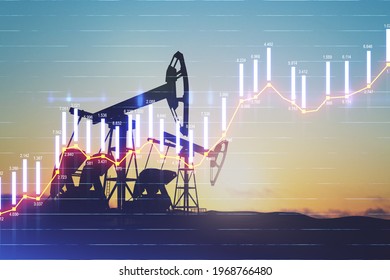
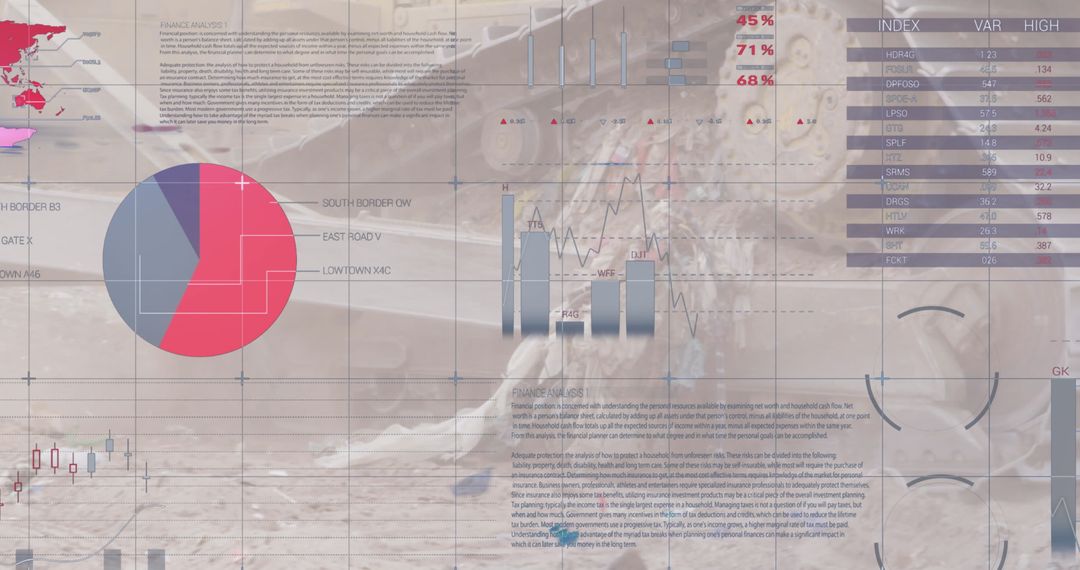
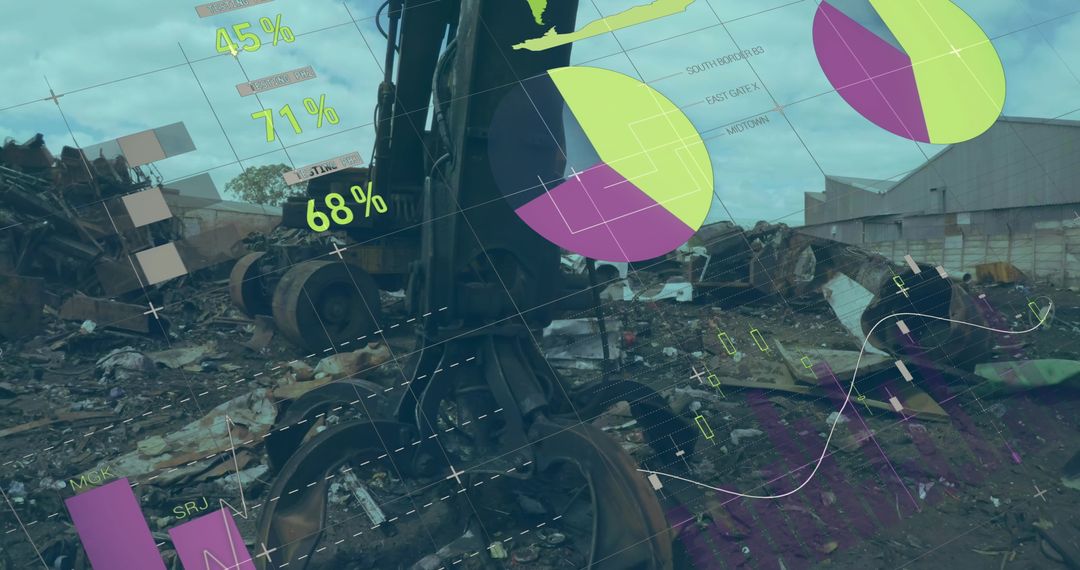
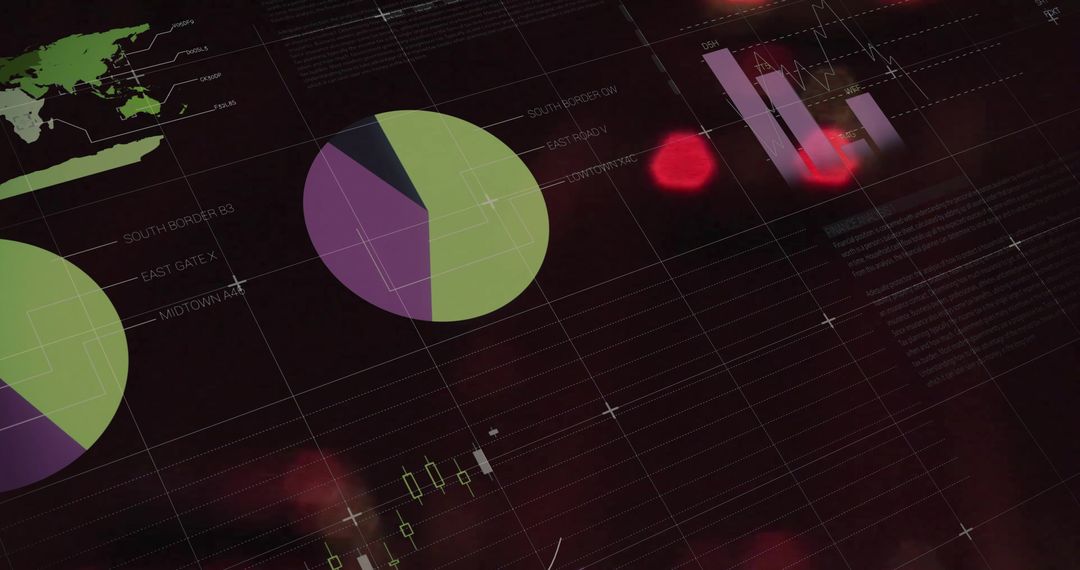
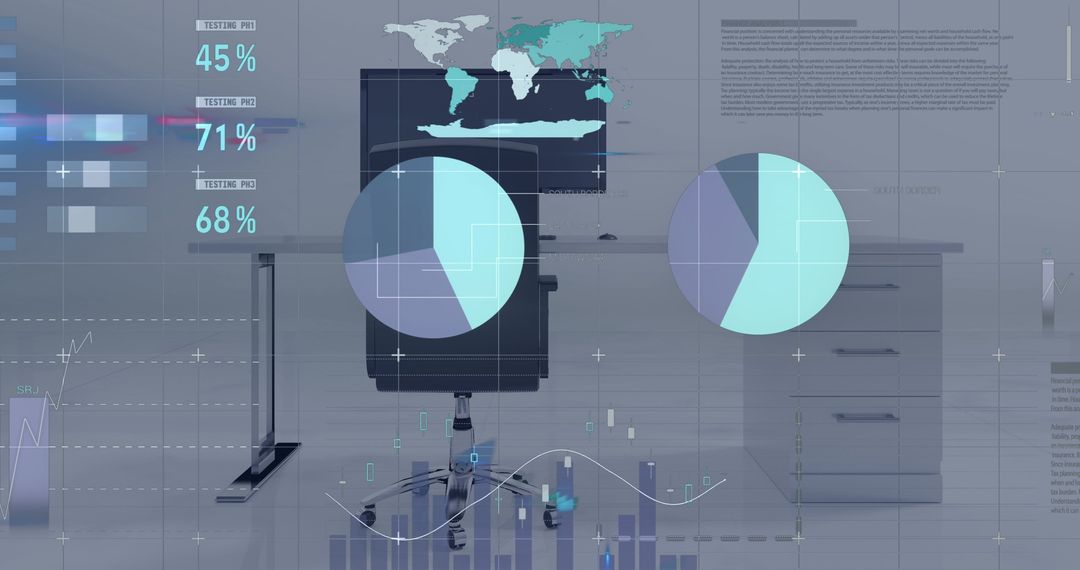
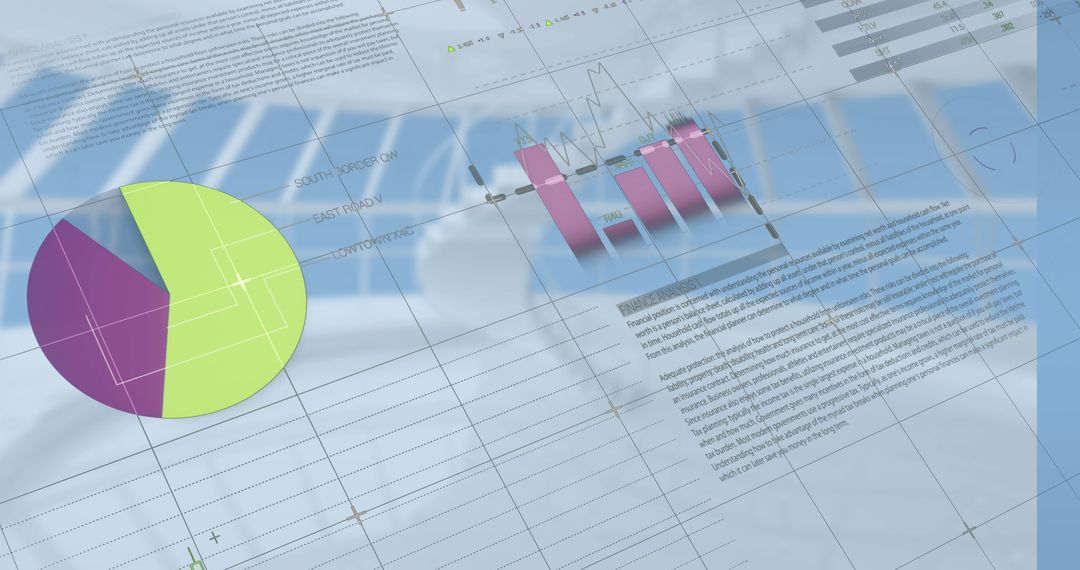
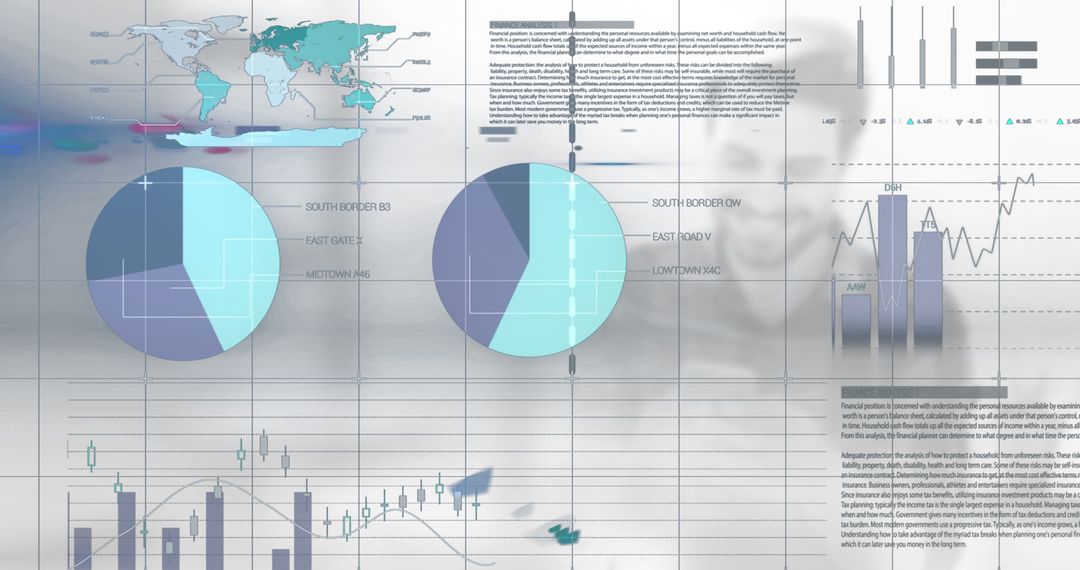
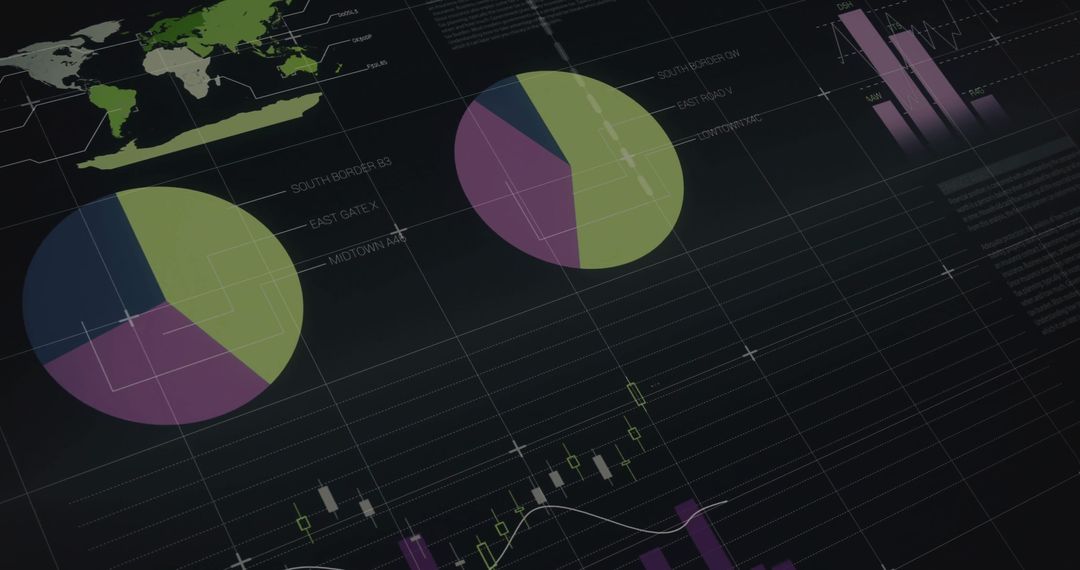
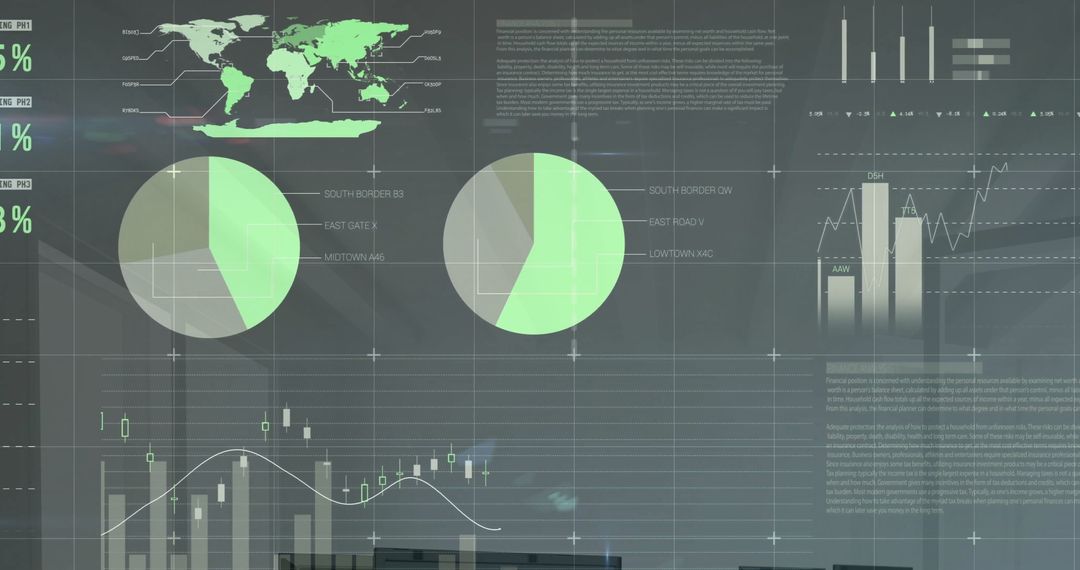
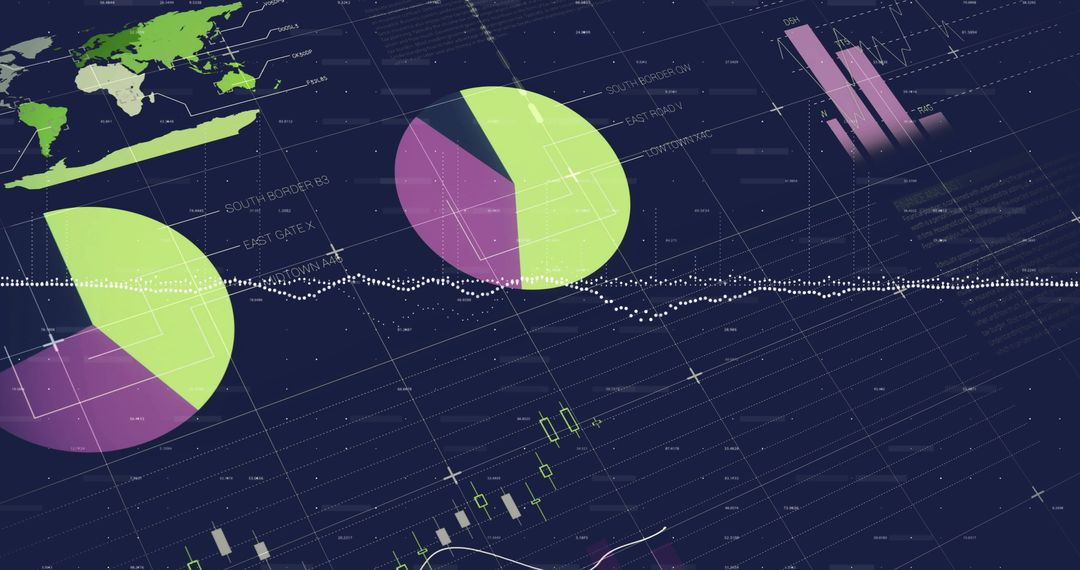
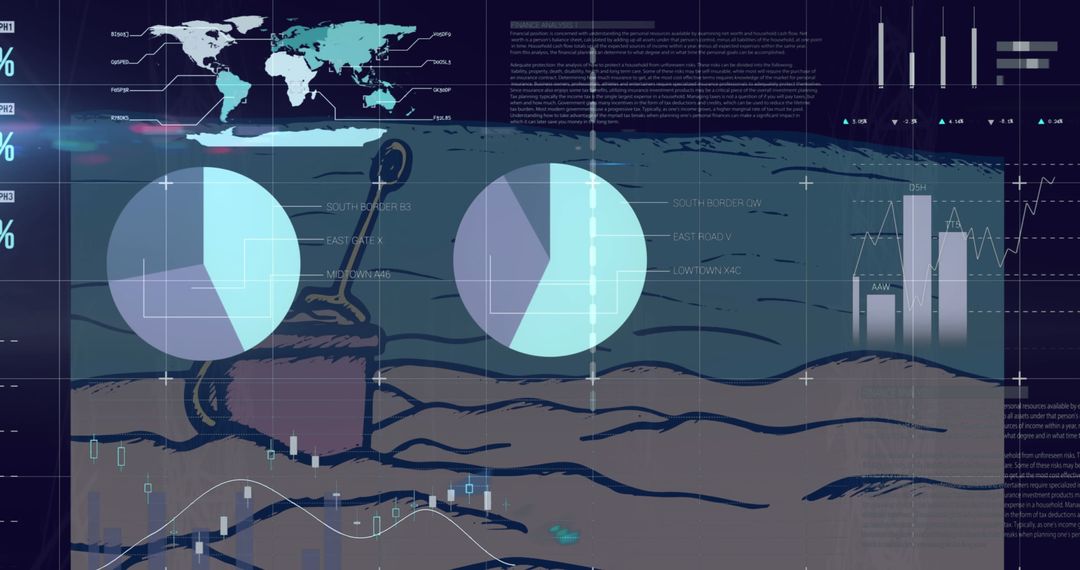
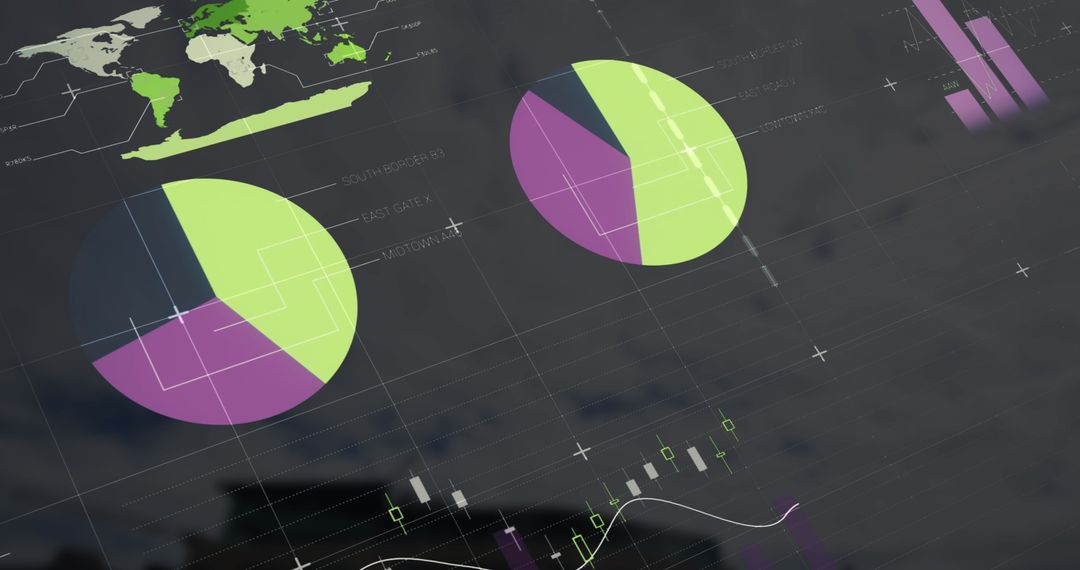
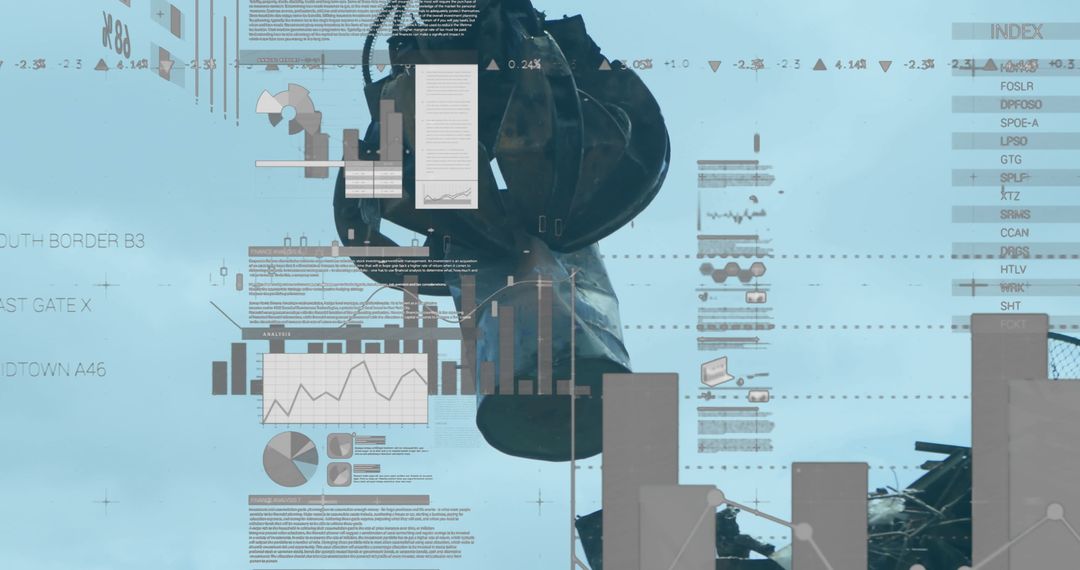
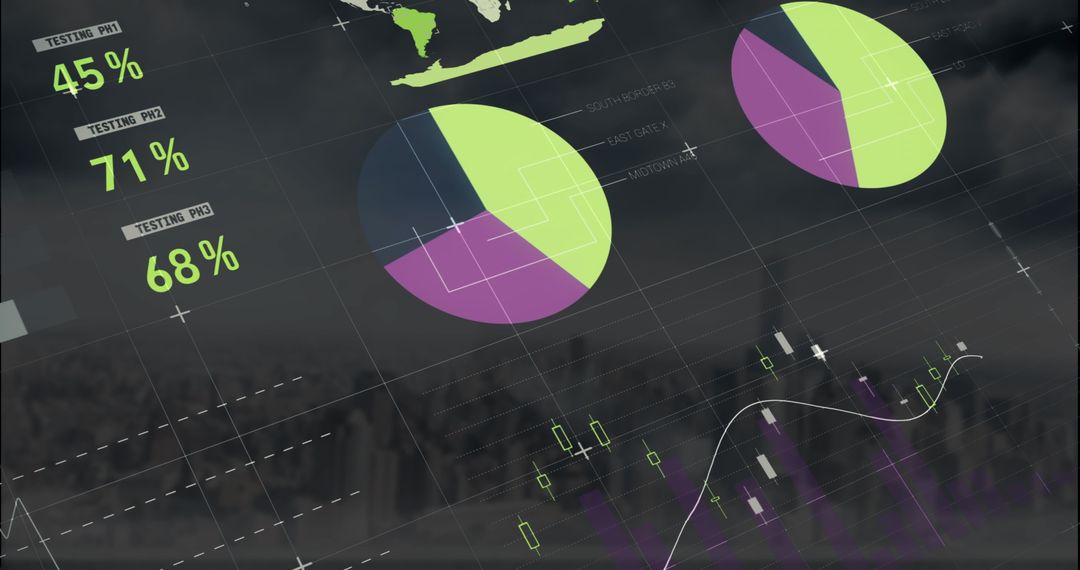
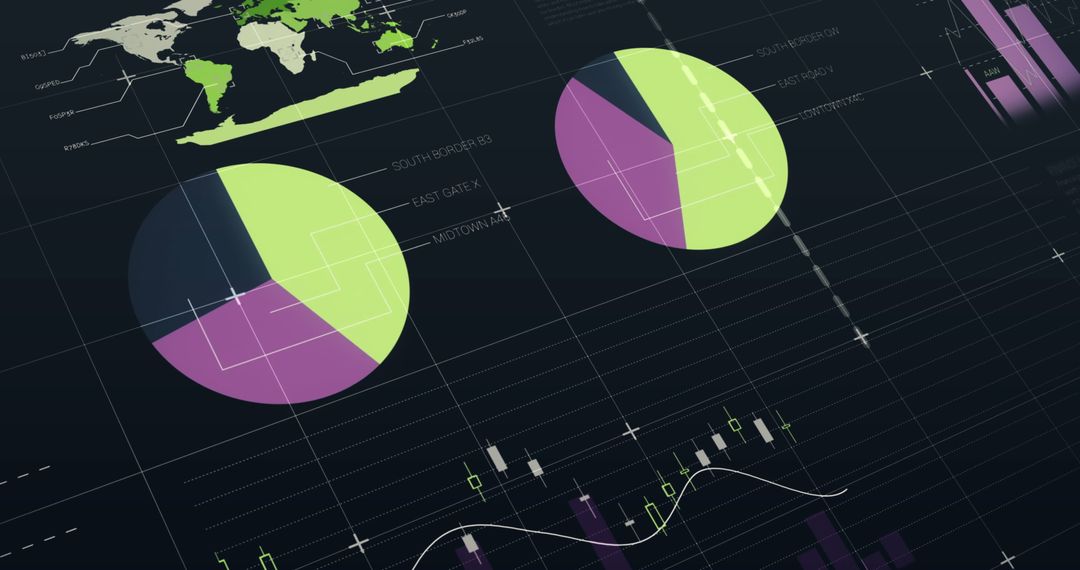
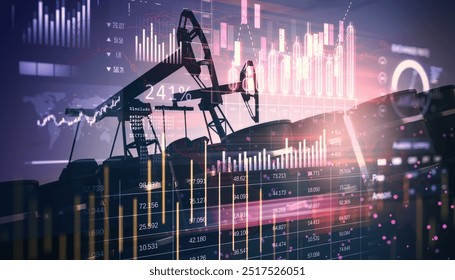
- Digital Visualization of Oil Industry with Graphs and Pump Jack
Digital Visualization of Oil Industry with Graphs and Pump Jack Image

Digital visuals blend with industrial images, showcasing the oil sector's data-driven approach. Useful for illustrating articles on energy markets, economic analyses, or technological advancements in the oil industry.
Powered by  - Get 15% off with code: PIKWIZARD15


6
downloads
downloads
Tags:
More
Credit Photo
If you would like to credit the Photo, here are some ways you can do so
Text Link
photo Link
<span class="text-link">
<span>
<a target="_blank" href=https://pikwizard.com/photo/digital-visualization-of-oil-industry-with-graphs-and-pump-jack/6f73667f97997c30cb66f9feced1e890/>PikWizard</a>
</span>
</span>
<span class="image-link">
<span
style="margin: 0 0 20px 0; display: inline-block; vertical-align: middle; width: 100%;"
>
<a
target="_blank"
href="https://pikwizard.com/photo/digital-visualization-of-oil-industry-with-graphs-and-pump-jack/6f73667f97997c30cb66f9feced1e890/"
style="text-decoration: none; font-size: 10px; margin: 0;"
>
<img src="https://pikwizard.com/pw/medium/6f73667f97997c30cb66f9feced1e890.jpg" style="margin: 0; width: 100%;" alt="" />
<p style="font-size: 12px; margin: 0;">PikWizard</p>
</a>
</span>
</span>
Free (free of charge)
Free for personal and commercial use.
Author: People Creations
Similar Free Stock Images

Premium


Premium


Premium


Premium


Premium


Premium


Premium


Premium


Premium


Premium


Premium


Premium


Premium


Premium


Premium


Premium


Premium


Premium


Premium


Premium


Premium


Premium


Premium


Premium

