- Home >
- Stock Photos >
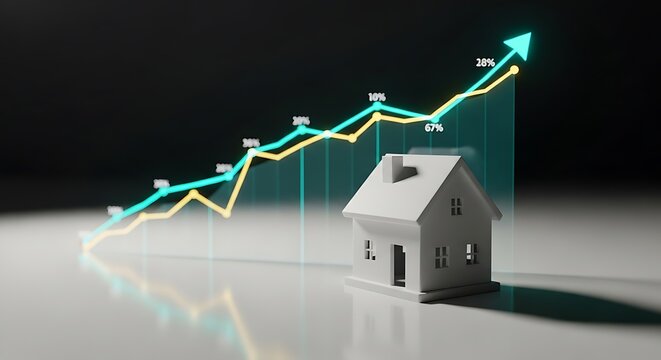
- Digital Visualization of Real Estate Market Trends with Data Graph
Digital Visualization of Real Estate Market Trends with Data Graph Image

Graphical representation of market trends superimposed on an image of a small house, illustrating current changes in the real estate industry. Use for conveying concepts related to real estate investment, market analysis, or the impact of data on property decision-making.
Powered by 


4
downloads
downloads
Tags:
More
Credit Photo
If you would like to credit the Photo, here are some ways you can do so
Text Link
photo Link
<span class="text-link">
<span>
<a target="_blank" href=https://pikwizard.com/photo/digital-visualization-of-real-estate-market-trends-with-data-graph/673f4ee91081f66e67c86b8bbd8aa9c0/>PikWizard</a>
</span>
</span>
<span class="image-link">
<span
style="margin: 0 0 20px 0; display: inline-block; vertical-align: middle; width: 100%;"
>
<a
target="_blank"
href="https://pikwizard.com/photo/digital-visualization-of-real-estate-market-trends-with-data-graph/673f4ee91081f66e67c86b8bbd8aa9c0/"
style="text-decoration: none; font-size: 10px; margin: 0;"
>
<img src="https://pikwizard.com/pw/medium/673f4ee91081f66e67c86b8bbd8aa9c0.jpg" style="margin: 0; width: 100%;" alt="" />
<p style="font-size: 12px; margin: 0;">PikWizard</p>
</a>
</span>
</span>
Free (free of charge)
Free for personal and commercial use.
Author: Authentic Images
Similar Free Stock Images

Premium


Premium


Premium


Premium


Premium


Premium


Premium


Premium


Premium


Premium


Premium


Premium


Premium


Premium


Premium


Premium


Premium


Premium


Premium


Premium


Premium


Premium


Premium


Premium