- Home >
- Stock Photos >
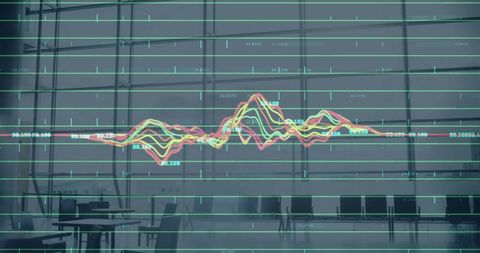
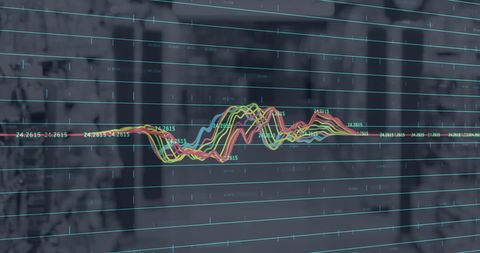
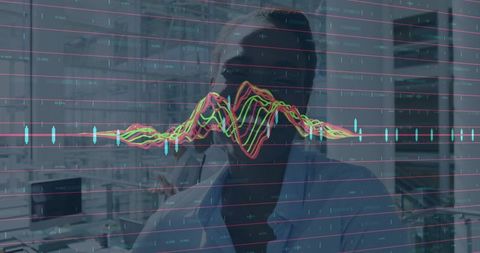
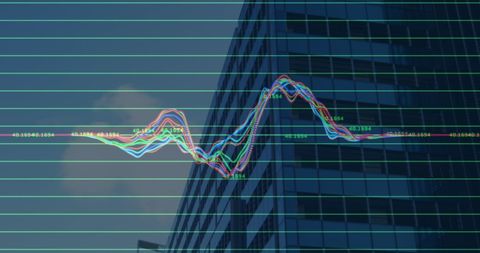
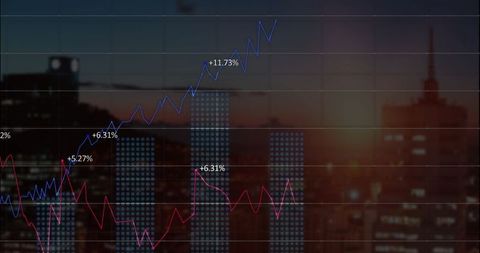
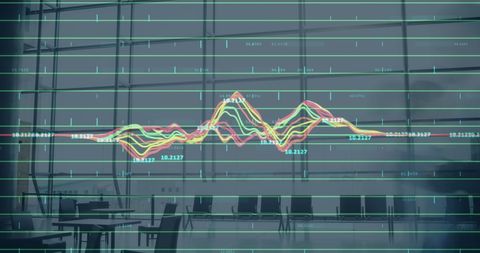
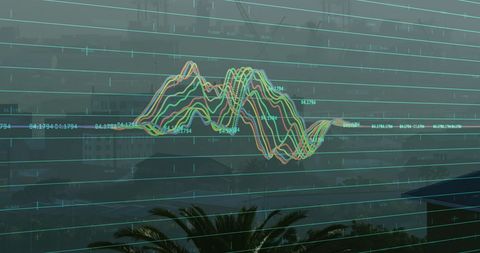
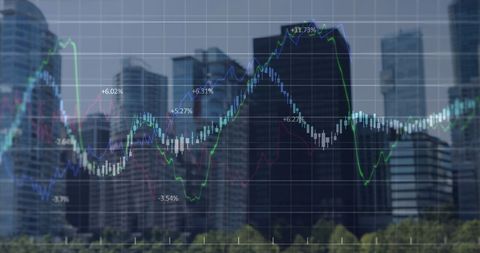
- Digital Waveform Chart with Candlestick Patterns on Wall
Digital Waveform Chart with Candlestick Patterns on Wall Image

The digital waveform chart exhibits vibrant lines and candlestick patterns against a shaded background, accentuated by red grid lines and axis labels, positioning itself as a useful tool for presentations or reports on financial analysis, data insights, and technology development. Suitable for contexts involving modern data storytelling and explanation of complex information through visual mediums.

downloads
Tags:
More
Credit Photo
If you would like to credit the Photo, here are some ways you can do so
Text Link
photo Link
<span class="text-link">
<span>
<a target="_blank" href=https://pikwizard.com/photo/digital-waveform-chart-with-candlestick-patterns-on-wall/467a2f2371c7ea513565b69bf2caeb65/>PikWizard</a>
</span>
</span>
<span class="image-link">
<span
style="margin: 0 0 20px 0; display: inline-block; vertical-align: middle; width: 100%;"
>
<a
target="_blank"
href="https://pikwizard.com/photo/digital-waveform-chart-with-candlestick-patterns-on-wall/467a2f2371c7ea513565b69bf2caeb65/"
style="text-decoration: none; font-size: 10px; margin: 0;"
>
<img src="https://pikwizard.com/pw/medium/467a2f2371c7ea513565b69bf2caeb65.jpg" style="margin: 0; width: 100%;" alt="" />
<p style="font-size: 12px; margin: 0;">PikWizard</p>
</a>
</span>
</span>
Free (free of charge)
Free for personal and commercial use.
Author: Awesome Content