- Home >
- Stock Photos >
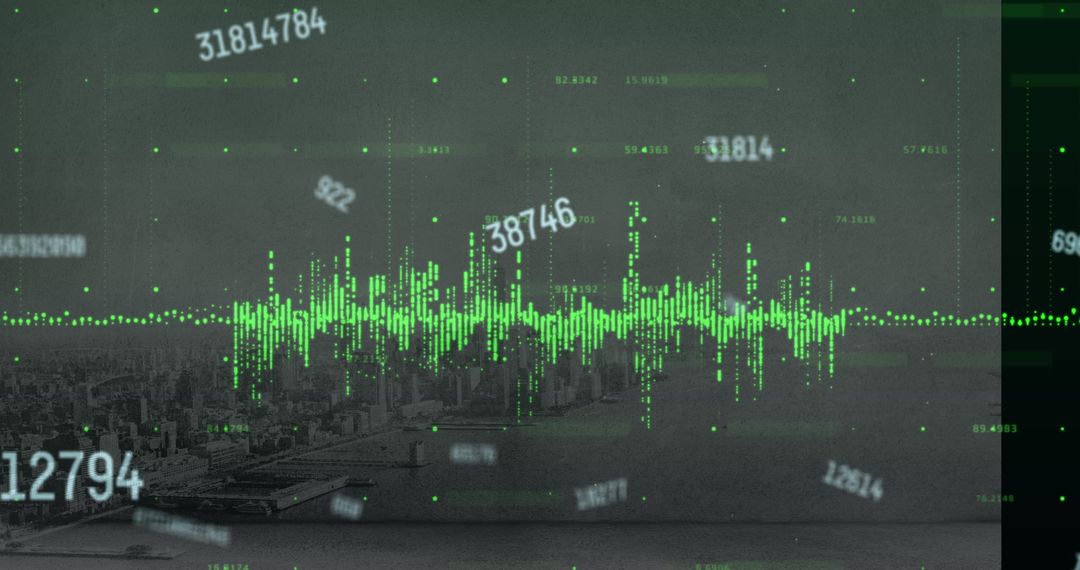
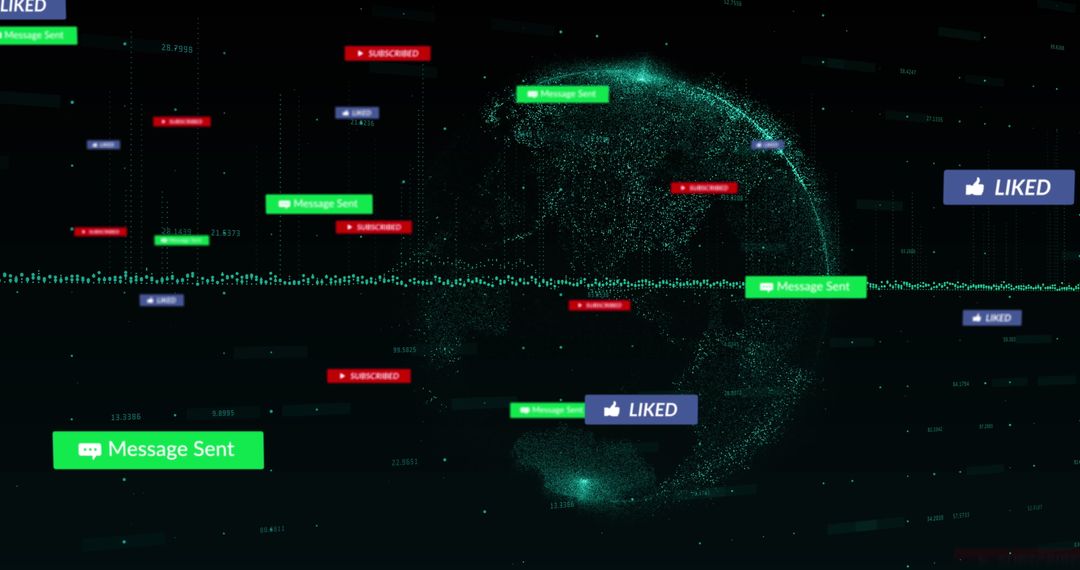
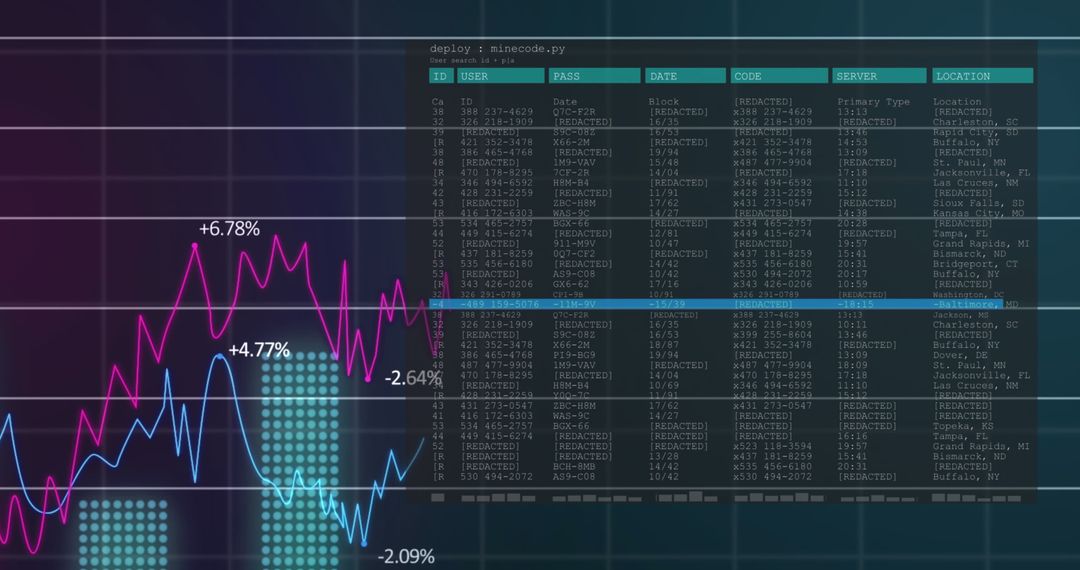
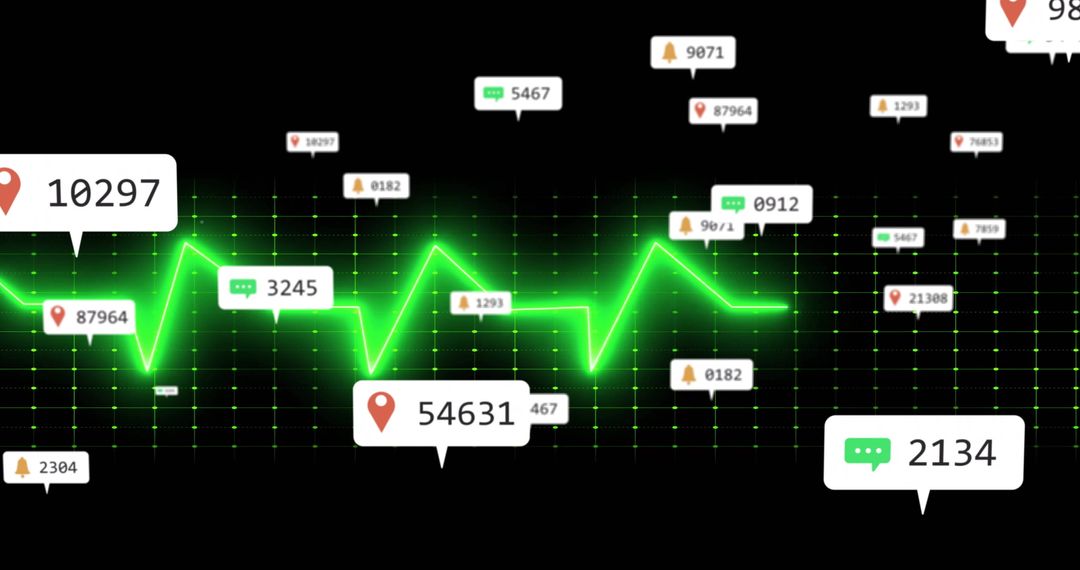
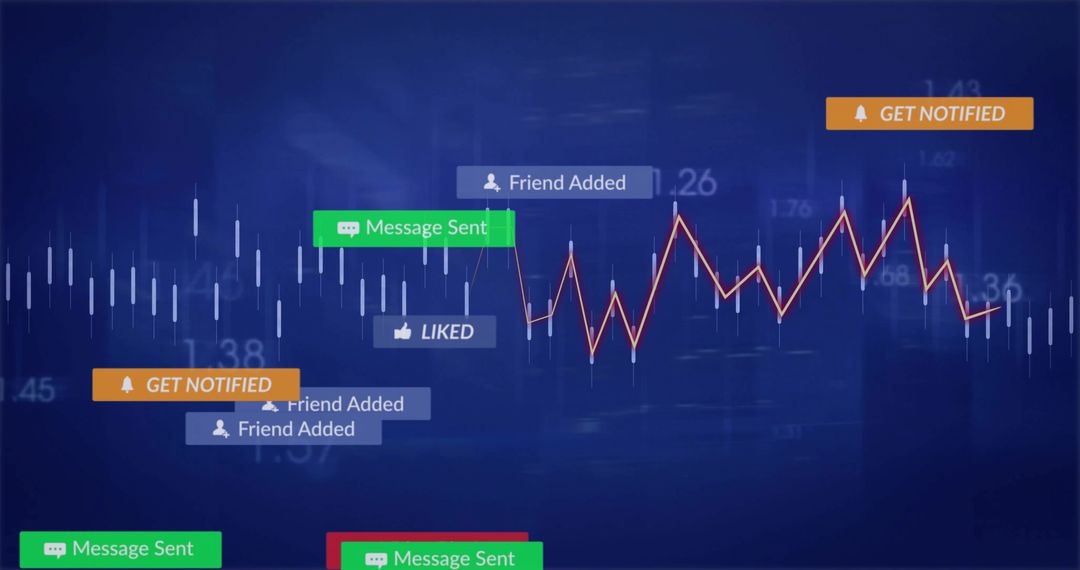
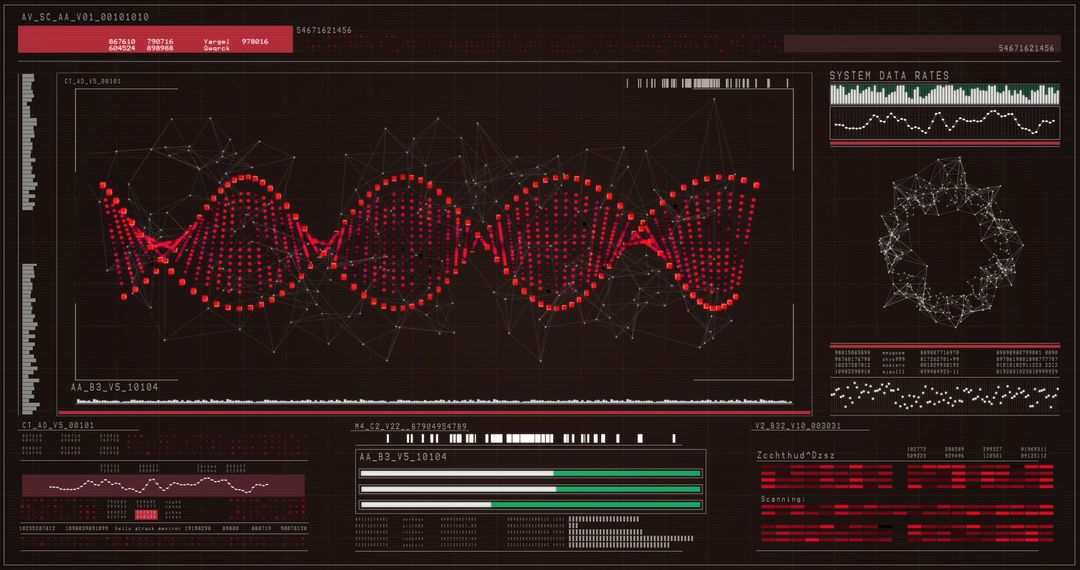
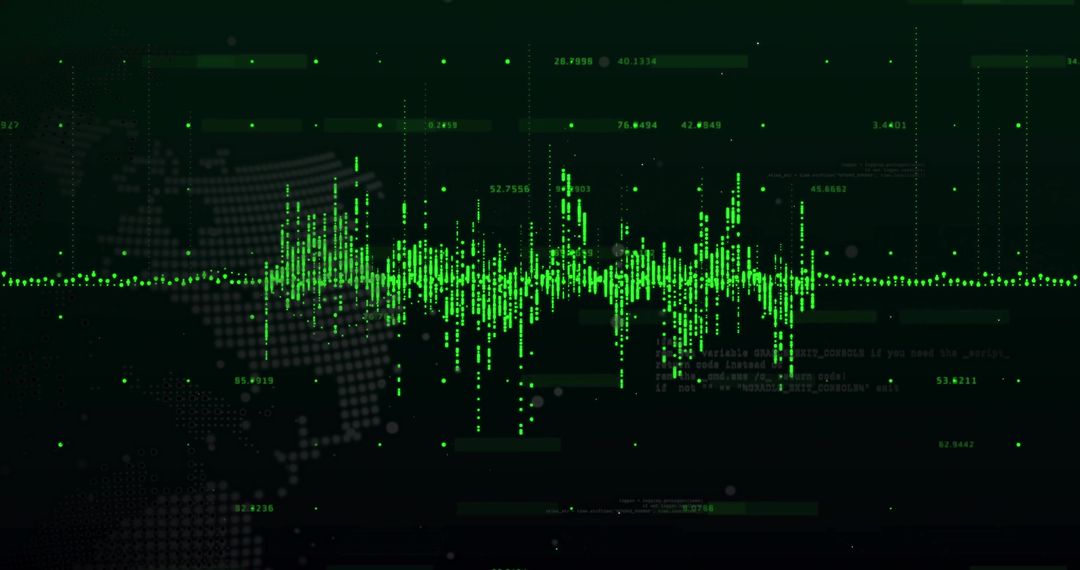
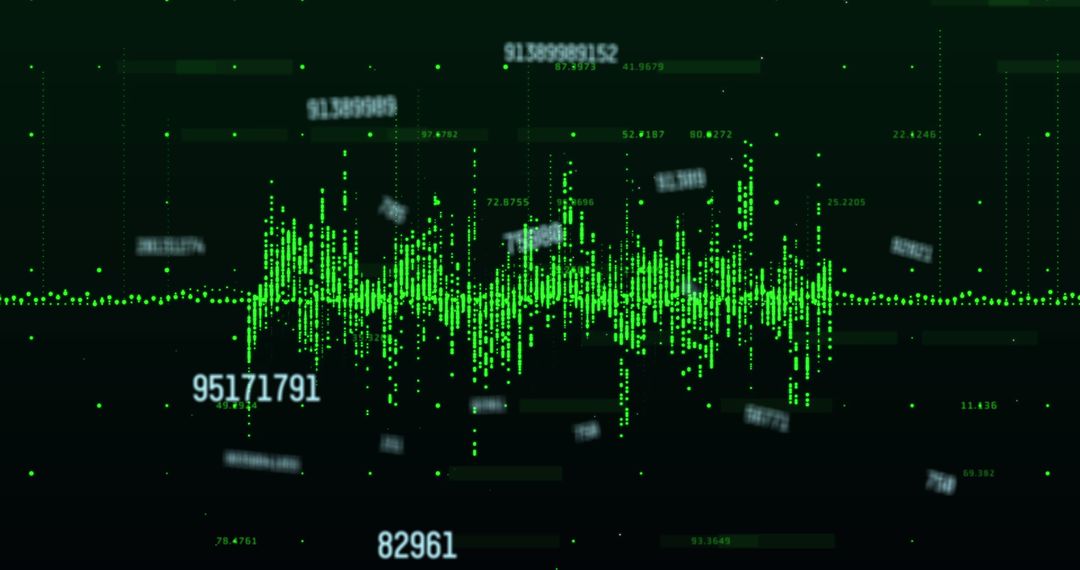
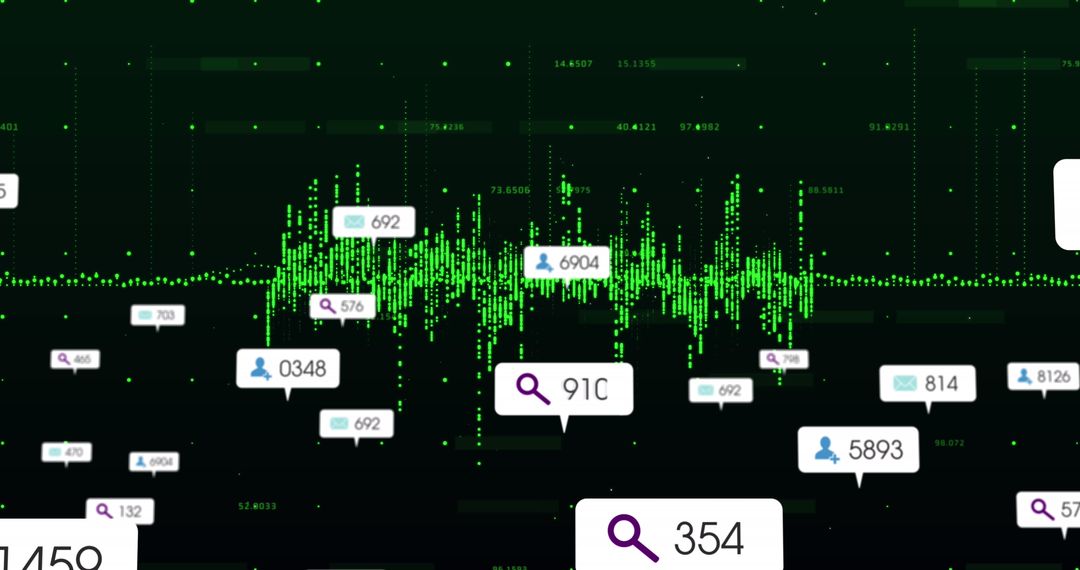
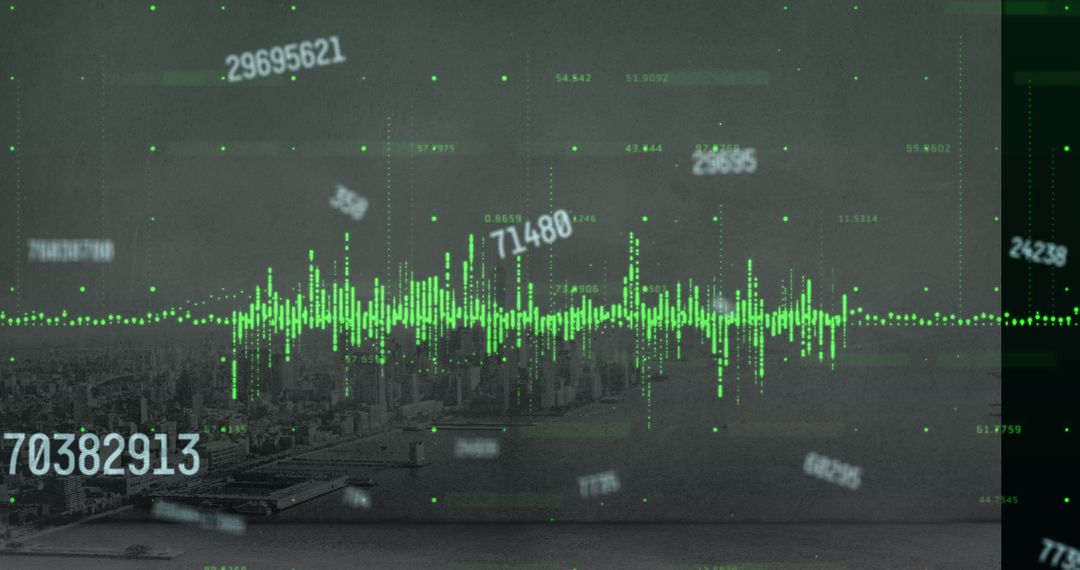
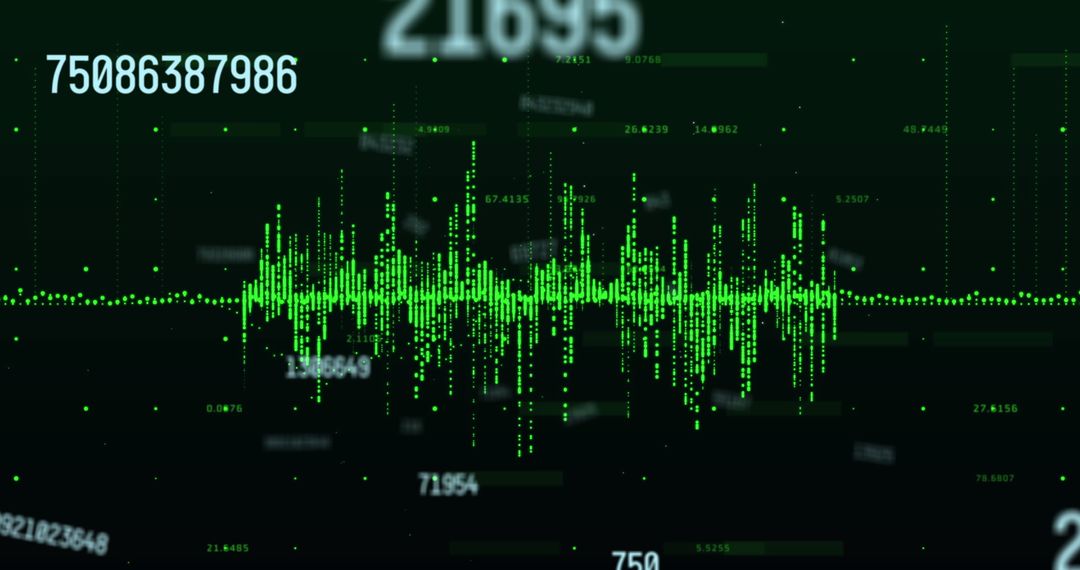
- Digital Waveform Graph with Social Media Notifications
Digital Waveform Graph with Social Media Notifications Image
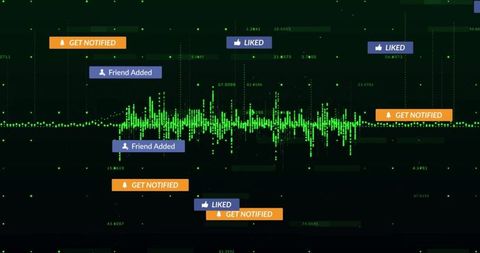
Futuristic digital waveform graph represents real-time network or data analytics on a computer interface, enhanced by floating social media notifications for increased viewer engagement. Ideal for illustrating technological advancements in data processing, online interaction trends, cybersecurity analysis, or modern information interfaces.
Powered by  - Get 15% off with code: PIKWIZARD15


0
downloads
downloads
Tags:
More
Credit Photo
If you would like to credit the Photo, here are some ways you can do so
Text Link
photo Link
<span class="text-link">
<span>
<a target="_blank" href=https://pikwizard.com/photo/digital-waveform-graph-with-social-media-notifications/bf14717d58badb0f5659e0fef1de20ac/>PikWizard</a>
</span>
</span>
<span class="image-link">
<span
style="margin: 0 0 20px 0; display: inline-block; vertical-align: middle; width: 100%;"
>
<a
target="_blank"
href="https://pikwizard.com/photo/digital-waveform-graph-with-social-media-notifications/bf14717d58badb0f5659e0fef1de20ac/"
style="text-decoration: none; font-size: 10px; margin: 0;"
>
<img src="https://pikwizard.com/pw/medium/bf14717d58badb0f5659e0fef1de20ac.jpg" style="margin: 0; width: 100%;" alt="" />
<p style="font-size: 12px; margin: 0;">PikWizard</p>
</a>
</span>
</span>
Free (free of charge)
Free for personal and commercial use.
Author: Awesome Content
Similar Free Stock Images